Measuring social change
The first challenge for measuring ‘need’ across the aging, healthcare and social sector is choosing what to measure. Then, how do we find what performance measurement and management systems are already in place? How do we measure the outcomes, processes, and structures when the issues facing older adults are so complex?
Each of the four areas addressed in this report are both the cause and effect of a number of interrelated factors. For example, someone who is struggling with the digital divide by experiencing technological difficulties may also be experiencing social isolation. Someone who is homebound may be using technology and home care for the first time. Someone receiving supplemental food may be also benefiting from reduced social isolation by the companionship of regular meal deliveries. The result is a lot of data, but not a lot of context within it.
No Standardized Measurements
This is compounded by the fact that there is no standard for measuring the complexities of aging. For example, the American Community Survey (ACS: the Census) measures disability in the community, but not mental health. The Centers for Disease Control and Prevention measures chronic mental health but not on the same age scale as the ACS. Therefore it’s not possible to compare the two statistics and include mental health in order to complete a picture of disability at a county or city level.
There isn’t even agreement as to when a person becomes a ‘senior’. Medicare collects information about health in adults aged 65 and more. Social Security is available to those 62 and older. The Older Americans Act programs, such as Adult Day Care, Congregate and Home Delivered Meals are available to people when they turn 60 and meet other qualifying factors. People are eligible to become members of AARP when they turn 50, and Feeding America tracks food insecurity data for individuals between the ages of 50 to 65.
Apart from age, there are many other personal factors that underpin nearly all of the challenges in this report. Poverty, race, ethnicity, sex, gender, disability and mental health, as well as other social determinants of health and well-being, affect an older adult’s experience of the world and their ability to cope. Measuring these intertwined elements is complex and imprecise, and needs to be cross-referenced from a variety of sources such as indices, annual reports, academic journals, and white papers.
This report, for example, has referenced 75+ data sets and aggregators, 25+ industry reports and nearly 100 academic papers, all of which are cited in the Key Resources, the link for which is at the end of this report.
This lack of coherent information also means that, while there are ‘many doors to entry’, most people who are in need of assistance stumble into the system for the first time when they are in crisis. Whether they are looking for help for themselves, a family member, neighbor or friend, they often have no knowledge or previous experience of what help is needed. Unless they are fortunate enough to connect with a care provider or social services agency that guides them, they have to reinvent the system for themselves.
“I got a pamphlet from the City of Santa Ana with a list of the classes at the senior center. I came for some of the exercise classes and the staff told me about the other services. Now I’ve told my neighbors and we all come, until COVID shut everything down. Now I still come to pick up the food and bring it to my neighbors who can’t get out.”
No Central Data Repository
While a significant amount of data is generated and held by OCSPA member organizations, including government agencies, social services and community-based organizations, there is no central data repository for information on older adults in Orange County or the State. Instead, there is an expanding network of organizations serving older adults in a multitude of ways, and the underlying data that they collect is spread over annual reports and disparate information systems that aren’t connected to other central resources. The same is true for information from healthcare, community surveys, and other research conducted on older adults.
Privacy Concerns
The County of Orange aggregates data from its own services and known partners, such as its contracted aging services partners, but is limited in the information it can share across its own departments (let alone externally) due to privacy concerns and legislative compliance.
Distributed System of Care
In order to understand how older adults experience social isolation, food insecurity, disability, and the digital divide, we need to understand the system of care they are living in. This distributed system involves many organizations providing different services in overlapping jurisdictions including national, state, county, city and local organizations - many of which are attempting to measure social isolation, digital divide and food insecurity within their area. The data we have found has been collated in the Appendices section on-line. Links to it are at the end of this document and represents approximately 80 reports, data sets, data aggregators and lists of resources relating to Orange County.
Many organizations coordinate or collaborate with each other where their missions overlap, e.g., member organizations of OCSPA and the Orange County Aging Services Collaborative (OCASC). This allows for shared information, whereas newer organizations may serve a specific region, population or niche without any broad knowledge or incorporation into the system of care. Members of the broader system of care are made aware of these efforts through press releases, government reports, or other indirect contacts. This means that, by and large, coordination within the system of care relies heavily on the knowledge networks of staff within organizations that know about other organizations in the sector. Becoming a part of such a network is obviously advantageous to all the organizations involved.

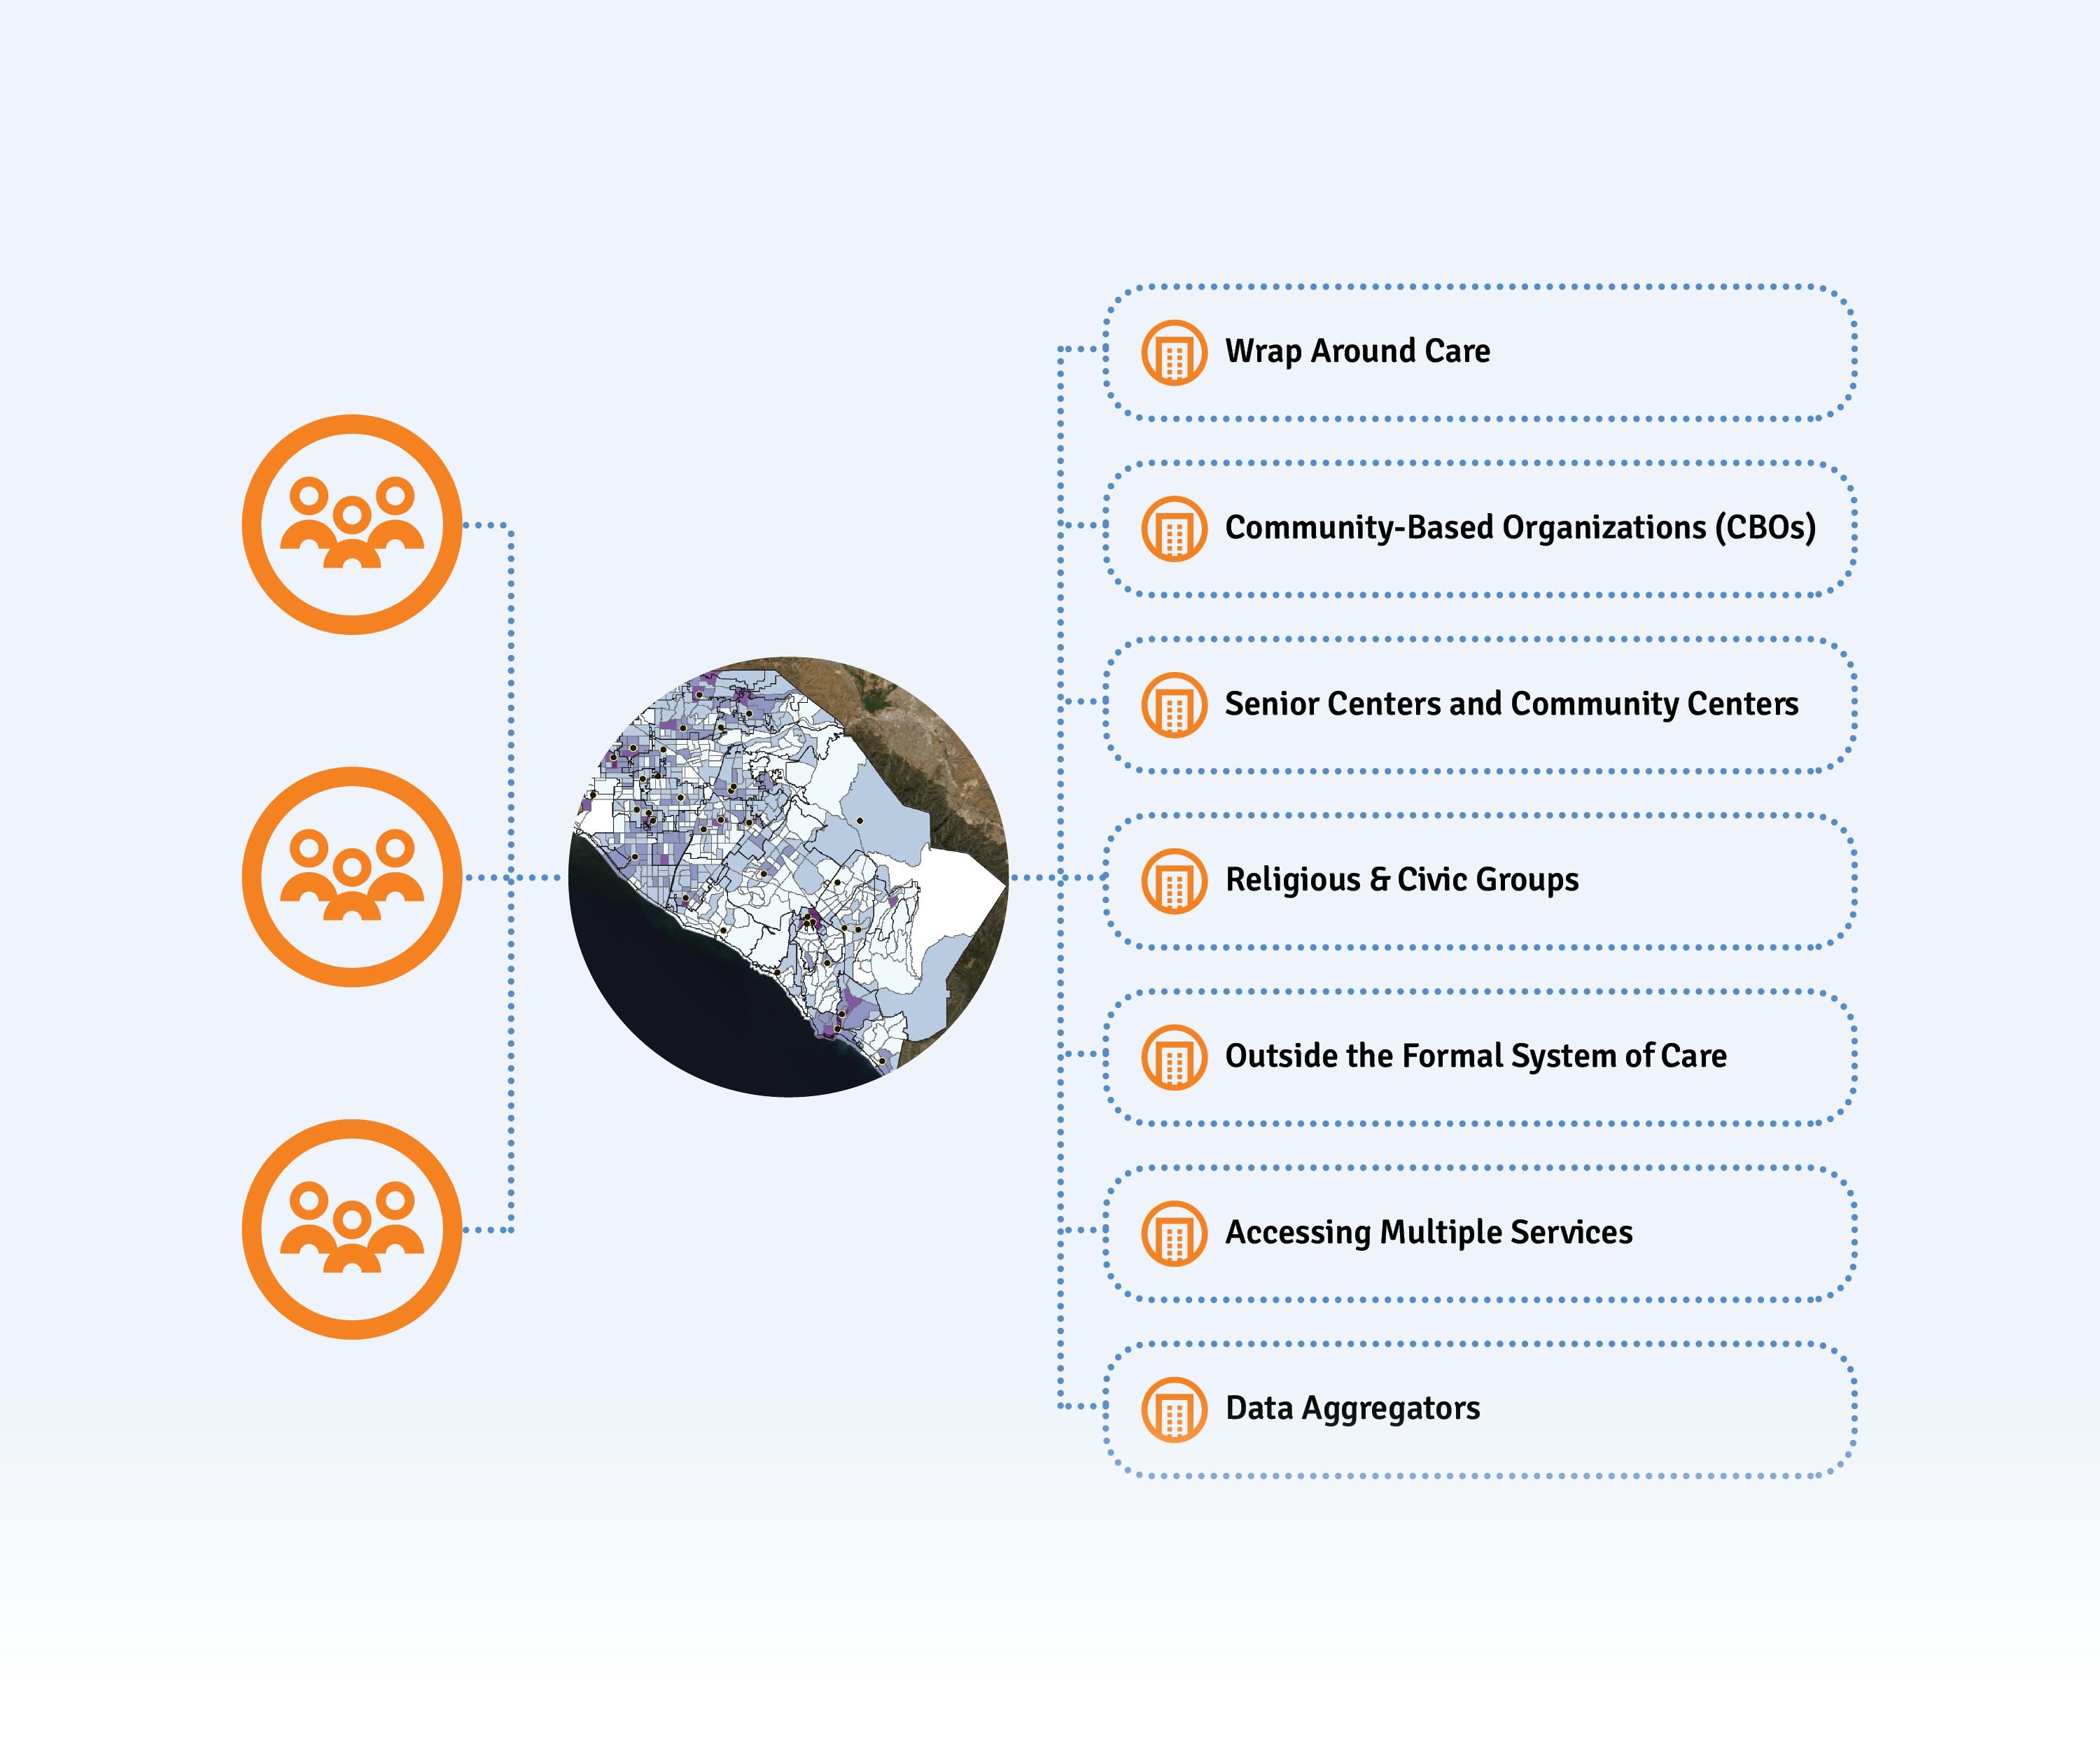
Wrap Around Care
Another concern for data collection is the fact that many organizations provide support for one issue while simultaneously supplying another (unmeasured) service. The ancillary care may be unreported in favor of the service that is measurable in time or money.
Community-Based Organizations (CBOs)
While government and civic agencies underpin the social security system, the bulk of the work in delivering support to senior citizens in Orange County is the result of efforts by community-based organizations. Orange County Aging Services Collaborative (OCASC) regularly brings together more than 40 organizations working towards creating an integrated network of services that address the needs of older adults and their caregivers in Orange County.


The Orange County Community Foundation (OCCF) is home to more than 600 charitable funds benefiting a wide range of causes. Their charity aggregator, OC Nonprofit Central gives detailed information about Orange County organizations all in one place. While there isn’t a specific CBO aggregation for senior citizens, the website does list dozens of CBOs whose scope includes older adults
Senior Centers and Community Centers
Senior centers and community centers are multi-use hubs of activity and support for older adults.
The centers often provide more than one service at a time. Congregate meal services (group dining) are provided at senior centers through a partner like Meals on Wheels Orange County or Age Well Senior Services. At the same center, take-home groceries may be provided by Second Harvest Food Bank or OC Food Bank (a program of CAPOC). Not only is nutrition provided, but also sociability and companionship.This set of services which is integrated for the recipient appears as compartmentalized data in separate funder reports.
Through programming at the senior center, the same individuals may be receiving technology training and using the computer lab, accessing classes taught by community groups, or engaging in health screenings. As a bi-product of all this activity,senior centers and adult day care centers provide valuable respite for caregivers. This is beneficial to the community, but creates complexity in the measuring of social value when social support is provided to both the older adult and caregiver - but the benefit may only be measured in meals served, or classes attended.
While most centers receive their primary support from the city, they may also receive funding from federal, county, philanthropic and community organizations. Because they receive funding from a variety of sources, the available data about the usage of their services is not available in a centralized way. Valuable data and anecdotal information about the success of useful initiatives is lost.
Religious & Civic Groups
Information about religious and civic group participation and support is largely absent from current data unless these efforts are externally funded and have data-reporting requirements.
For example, the Sikh Center of Orange County distributes 19,375 pounds of food and serves approximately 3,500 people each month. Because it is affiliated with OC Food Bank, they are required to report those numbers. However, they also serve Langar (community meals) to anyone as part of their seva, or selfless service. Those community meals build community and protect against social isolation among older adults in a way that a food pantry cannot - but the numbers are not reported.
The Catholic Diocese also provides a number of human services including the support for adults with special needs, and the Doris Cantlay Food Distribution Center, but actual data about delivery of these services is difficult to find.
Outside the Formal System of Care
Organizations that provide direct support on an issue (such as social isolation, digital divide, or food insecurity) may not consider themselves to be part of the system of care for older adults because they serve the general population. Religious congregations, cities, and food pantries fall into this category. Age-specific information about much of their work is hard to find.
Some senior-focused programs like Osher Lifelong Learning Institute (OLLI) and Saddleback College Emeritus Institute also may not consider themselves as part of the system of care because they function independently of County and CBO funding. Thus their information is ‘missing’ when trying to estimate the needs of older-adults.
Accessing Multiple Services
The opposite is also true with the possibility of ‘double dipping’ in the data - where one person or group is appropriately using multiple services, but there is no ability to aggregate usage at the person-level in order to determine if specific individuals may need additional services.
In some cases, their data may not be captured at all, such as some types of food distributions that do not record who the recipients are, or other types of walk-in programming.

This is particularly relevant for adults in the 50 to 64 years age group, who may not be eligible for some benefits, or within the 200% poverty margin, who may be experiencing job loss, illness, or wage loss, and who experience worsening health outcomes because of a need to choose between food, rent, utilities and medicine. This lack of visibility into the system of care may also hide the number of people who are slipping through the safety net altogether.
Data Aggregators
There are a number of open source data aggregators which allow us to view demographic data in different regional views. Details and links can be found in the Key Resources.

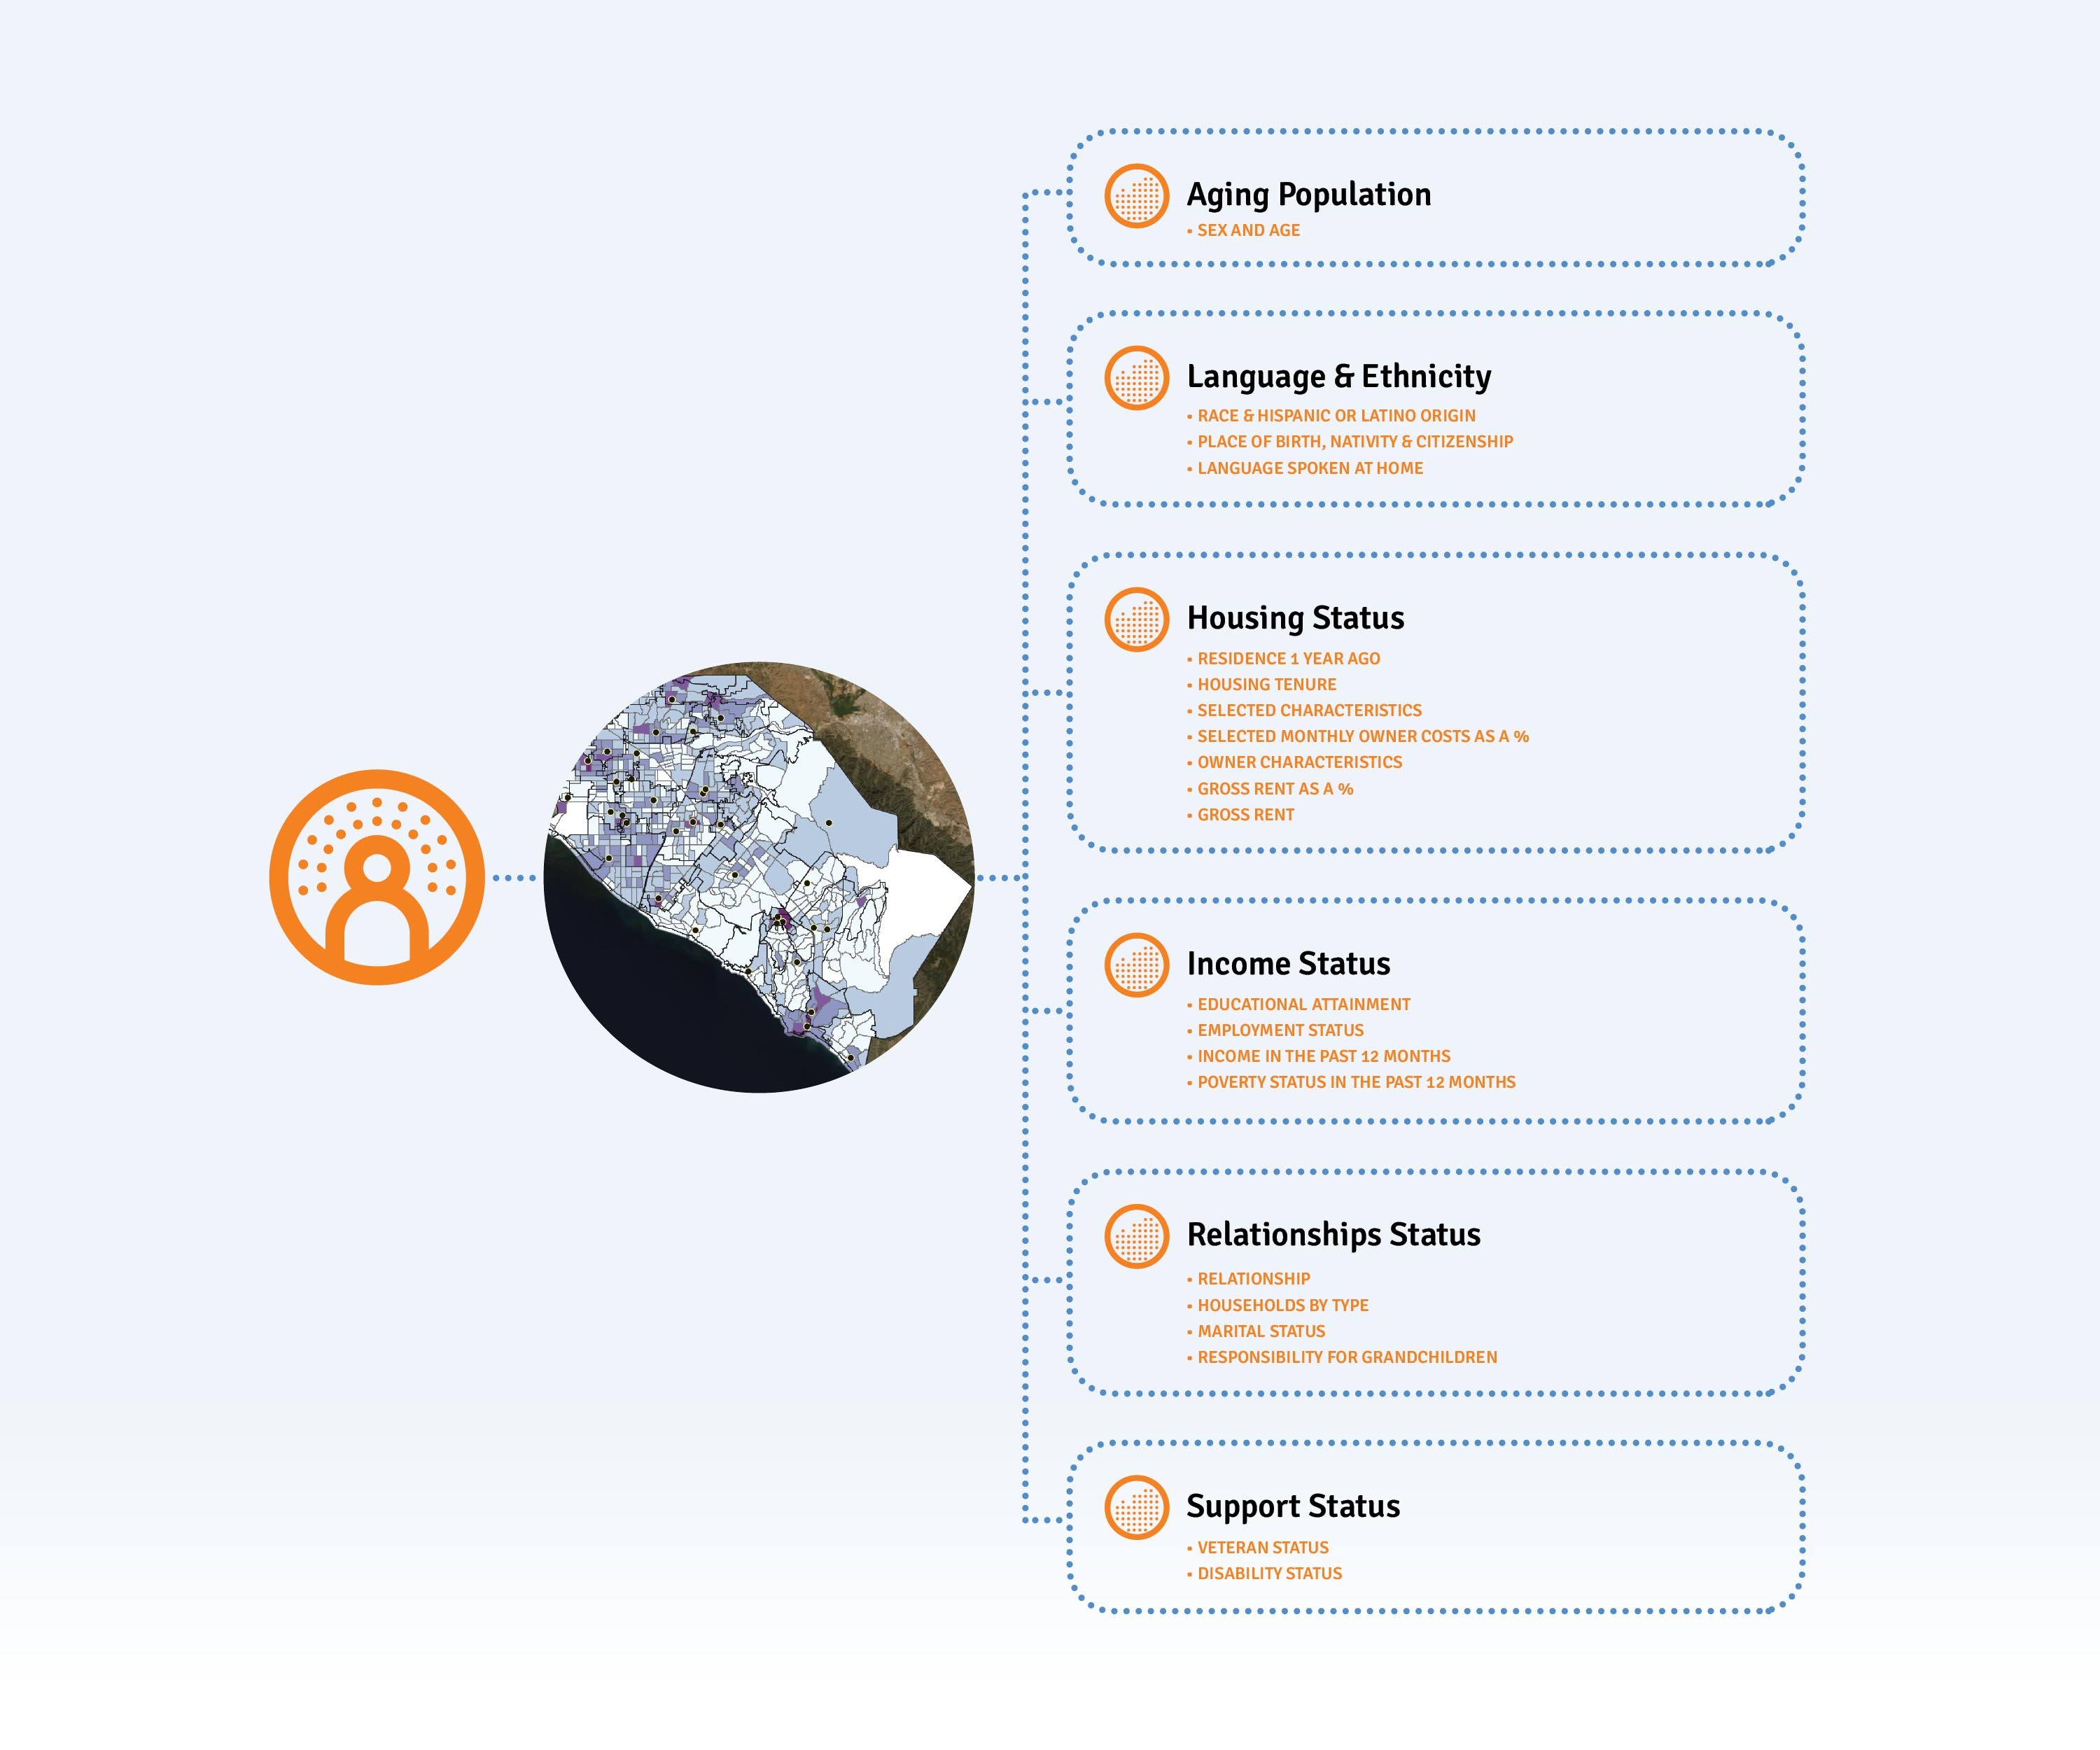
Orange County Data Portrait
According to the US Census Bureau, Orange County is diverse. It is the home of some of the wealthiest and most impoverished Americans. The county is a minority-majority community with residents from a wide range of racial and ethnic backgrounds. They speak diverse languages and participate in society in a wide range of ways. All of these factors play a role in the experience of older adults. Being able to correctly identify older adults is vital in order to prepare and respond to future needs.
| Label | OC Estimate | 60+ OC Estimate |
|---|---|---|
| Total population | 3,175,692 | 681,997 |
| SEX AND AGE | ||
| Male | 49.4% | 45.2% |
| Female | 50.6% | 54.8% |
| Median age (years) | 38.6 | 70.0 |
| Label | OC Estimate | 60+ OC Estimate |
|---|---|---|
| RACE AND HISPANIC OR LATINO ORIGIN | ||
| One race | 95.8% | 98.3% |
| White | 59.2% | 68.6% |
| Black or African American | 1.7% | 1.3% |
| American Indian and Alaska Native | 0.4% | 0.4% |
| Asian | 21.2% | 22.0% |
| Native Hawaiian and Other Pacific Islander | 0.4% | 0.2% |
| Some other race | 12.9% | 5.8% |
| Two or more races | 4.2% | 1.7% |
| Hispanic or Latino origin (of any race) | 34.0% | 17.3% |
| White alone, not Hispanic or Latino | 39.7% | 57.5% |
| Label | OC Estimate | 60+ OC Estimate |
|---|---|---|
| RELATIONSHIP | ||
| Population in households | 3,130,960 | 666,729 |
| Householder or spouse | 51.6% | 82.1% |
| Parent | 2.5% | 8.2% |
| Other relatives | 39.3% | 6.0% |
| Nonrelatives | 6.6% | 3.6% |
| Unmarried partner | 1.8% | 1.0% |
| Label | OC Estimate | 60+ OC Estimate |
|---|---|---|
| HOUSEHOLDS BY TYPE | ||
| Households | 1,044,280 | 372,829 |
| Family households | 71.5% | 62.5% |
| Married-couple family | 54.6% | 50.4% |
| Female householder, no spouse present, family | 11.4% | 8.6% |
| Nonfamily households | 28.5% | 37.5% |
| Householder living alone | 21.2% | 33.5% |

| Label | OC Estimate | 60+ OC Estimate |
|---|---|---|
| MARITAL STATUS | ||
| Population 15 years and over | 2,607,309 | 681,997 |
| Now married, except separated | 50.1% | 60.6% |
| Widowed | 4.7% | 16.1% |
| Divorced | 9.2% | 15.5% |
| Separated | 1.4% | 1.3% |
| Never married | 34.6% | 6.5% |
| Label | OC Estimate | 60+ OC Estimate |
|---|---|---|
| EDUCATIONAL ATTAINMENT | ||
| Population 25 years and over | 2,200,478 | 681,997 |
| Less than high school graduate | 13.9% | 15.1% |
| High school graduate, GED, or alternative | 17.8% | 17.6% |
| Some college or associate's degree | 27.3% | 30.0% |
| Bachelor's degree or higher | 41.0% | 37.3% |
| Label | OC Estimate | 60+ OC Estimate |
|---|---|---|
| RESPONSIBILITY FOR GRANDCHILDREN UNDER 18 YEARS | ||
| Population 30 years and over | 1,960,169 | 681,997 |
| Living with grandchild(ren) | 4.3% | 8.1% |
| Responsible for grandchild(ren) | 0.9% | 1.3% |
| Label | OC Estimate | 60+ OC Estimate |
|---|---|---|
| VETERAN STATUS | ||
| Civilian population 18 years and over | 2,484,014 | 681,997 |
| Civilian veteran | 3.9% | 9.5% |
| Label | OC Estimate | 60+ OC Estimate |
|---|---|---|
| DISABILITY STATUS | ||
| Civilian noninstitutionalized population | 3,157,964 | 674,878 |
| With any disability | 8.6% | 23.1% |
| No disability | 91.4% | 76.9% |
| Label | OC Estimate | 60+ OC Estimate |
|---|---|---|
| RESIDENCE 1 YEAR AGO | ||
| Population 1 year and over | 3,142,062 | 681,997 |
| Same house | 87.7% | 93.9% |
| Different house in the United States | 11.6% | 5.5% |
| Same county | 8.2% | 4.1% |
| Different county | 3.3% | 1.5% |
| Same state | 2.3% | 1.0% |
| Different state | 1.0% | 0.4% |
| Abroad | 0.7% | 0.5% |
| Label | OC Estimate | 60+ OC Estimate |
|---|---|---|
| PLACE OF BIRTH, NATIVITY AND CITIZENSHIP STATUS, AND YEAR OF ENTRY | ||
| Total population | 3,175,692 | 681,997 |
| Native | 2,225,867 | 421,104 |
| Foreign born | 949,825 | 260,893 |
| Entered 2010 or later | 16.9% | 4.7% |
| Entered 2000 to 2009 | 20.5% | 8.8% |
| Entered before 2000 | 62.5% | 86.5% |
| Naturalized U.S. citizen | 56.6% | 78.9% |
| Not a U.S. citizen | 43.4% | 21.1% |
| Label | OC Estimate | 60+ OC Estimate |
|---|---|---|
| LANGUAGE SPOKEN AT HOME AND ABILITY TO SPEAK ENGLISH | ||
| Population 5 years and over | 2,990,362 | 681,997 |
| English only | 53.4% | 61.4% |
| Language other than English | 46.6% | 38.6% |
| Speak English less than "very well" | 18.2% | 25.5% |
| Label | OC Estimate | 60+ OC Estimate |
|---|---|---|
| EMPLOYMENT STATUS | ||
| Population 16 years and over | 2,568,184 | 681,997 |
| In labor force | 65.9% | 33.0% |
| Civilian labor force | 65.8% | 33.0% |
| Employed | 63.1% | 32.0% |
| Unemployed | 2.7% | 1.0% |
| Percent of civilian labor force | 4.1% | 3.1% |
| Armed forces | 0.1% | 0.0% |
| Not in labor force | 34.1% | 67.0% |
| Label | OC Estimate | 60+ OC Estimate |
|---|---|---|
| INCOME IN THE PAST 12 MONTHS (IN 2019 INFLATION-ADJUSTED DOLLARS) | ||
| Households | 1,044,280 | 372,829 |
| With earnings | 82.1% | 56.4% |
| Mean earnings (dollars) | 126,644 | 105,902 |
| With Social Security income | 28.0% | 68.0% |
| Mean Social Security income (dollars) | 20,422 | 21,532 |
| With Supplemental Security Income | 4.3% | 6.6% |
| Mean Supplemental Security Income (dollars) | 9,912 | 9,861 |
| With cash public assistance income | 1.4% | 1.4% |
| Mean cash public assistance income (dollars) | 4,496 | 4,616 |
| With retirement income | 21.8% | 47.7% |
| Mean retirement income (dollars) | 36,032 | 39,070 |
| With Food Stamp/SNAP benefits | 4.9% | 4.4% |
| Label | OC Estimate | 60+ OC Estimate |
|---|---|---|
| POVERTY STATUS IN THE PAST 12 MONTHS | ||
| Population for whom poverty status is determined | 3,138,405 | 674,878 |
| Below 100 percent of the poverty level | 9.4% | 8.2% |
| 100 to 149 percent of the poverty level | 5.9% | 6.5% |
| At or above 150 percent of the poverty level | 84.7% | 85.3% |
| Occupied housing units | 1,044,280 | 372,829 |
| Label | OC Estimate | 60+ OC Estimate |
|---|---|---|
| HOUSING TENURE | ||
| Owner-occupied housing units | 57.1% | 74.6% |
| Renter-occupied housing units | 42.9% | 25.4% |
| Average household size of owner-occupied unit | 2.96 | 2.36 |
| Average household size of renter-occupied unit | 3.05 | 2.06 |
| Label | OC Estimate | 60+ OC Estimate |
|---|---|---|
| SELECTED CHARACTERISTICS | ||
| No telephone service available | 0.8% | 0.7% |
| 1.01 or more occupants per room | 8.7% | 2.9% |
| Owner-occupied housing units | 596,413 | 277,975 |
| Label | OC Estimate | 60+ OC Estimate |
|---|---|---|
| SELECTED MONTHLY OWNER COSTS AS A PERCENTAGE OF HOUSEHOLD INCOME IN THE PAST 12 MONTHS | ||
| Less than 30 percent | 70.2% | 70.2% |
| 30 percent or more | 29.8% | 29.8% |
| Label | OC Estimate | 60+ OC Estimate |
|---|---|---|
| OWNER CHARACTERISTICS | ||
| Median value (dollars) | 725,100 | 722,300 |
| Median selected monthly owner costs with a mortgage (dollars) | 2,838 | 2,441 |
| Median selected monthly owner costs without a mortgage (dollars) | 677 | 625 |
| Renter-occupied housing units | 447,867 | 94,854 |
| GROSS RENT AS A PERCENTAGE OF HOUSEHOLD INCOME IN THE PAST 12 MONTHS | ||
| Less than 30 percent | 48.4% | 38.3% |
| 30 percent or more | 51.6% | 61.7% |
| Label | OC Estimate | 60+ OC Estimate |
|---|---|---|
| GROSS RENT | ||
| Median gross rent (dollars) | 1,929 | 1,647 |

Aging in Orange County
Americans are living longer. While there was a small fall in the average life expectancy in 2020 due to Covid, the pre-pandemic average life expectancy was 78 years for men and 80 years for women. Since 2010, the county has grown by 5.87% from 3,010,232 to 3,186,232 - close to 177,000 more people. However, at the same time, the amount of young people in the county decreased, with people under 18 comprising just under 21% in 2020, compared to 24.5% in 2010.
The 2020 American Community Survey (ACS) estimated that 485,296 (or 15.3%) of Orange County residents were 65+ at the end of 2019. This rate is less than the 16.5% countrywide, but higher than the 14.8% for California. However, in some cities such as Laguna Woods, home of Laguna Woods Village (formerly known as Leisure World Laguna Hills) the percentage of older residents rises as high as 82.8%, and older adults are increasing as a proportion of the population.
Further, the California Department of Finance estimates that 26.1% of the OC population will be 65+ by 2060, up from 15.7% in 2020. The 2021-22 Orange County Community Indicator Report projects that the 65+ population in OC will grow from 17% to 27% by 2060. Largely due to decades of declining birthrates, this age group is the only demographic expected to grow between 2021-2060. The population change by age cohort in Orange County demonstrates that Orange County is getting older, faster than the rest of California, particularly with regard to the 65+ age groups.
Approximately 269,368 (55.5%) of those 65+ are female and 215,928 (45.5%) are male. Given that the county average for women is 50.7%, it suggests a 4.8% swing towards women living longer than men after age 65.
In a report titled: Childless Older Americans, the U.S. Census Bureau shows that 15.2 million, nearly 1 in 6 (16.5%) adults age 55 and older are childless - and the levels of childlessness among older adults is increasing. Smaller family sizes, a lowering birth rate and living longer present a problem for caring for older adults. There will be fewer family caregivers in the future and fewer young adults to enter the caregiving profession.
Older Adults are relatively evenly distributed through the county with a slightly greater concentration in the south east and central north of the county. Analyzing the percent of the population in different age groups in all of the census block groups shows how as age increases, the older adult population becomes more highly concentrated in fewer neighborhoods where there are numerous communities designed for older adults in municipalities such as Laguna Woods (82.8%) and Leisure World (96.6%) in Seal Beach (39.9%).
Race and Ethnicity
Using data from the Census, an article in Voice of OC (2021) reports that since 2003, Orange County has been a minority-majority county, meaning the non-Hispanic White population no longer comprises more than 50% of the county population. The amount of White people has continued to decrease over the last decade by roughly 24%, while other groups like Asian-Americans (including those of mixed race) have grown by roughly 33%. The county’s Hispanic and/or Latino populations have also increased by roughly 7%, and the Black population increased by approximately 6%.
One difficulty in assessing the ethnic makeup of the community is defining race versus ethnicity. The American Community Survey and the U.S. Census Bureau counted around 41,000 Arab Americans living in Orange County in 2017, however they are included within the White population, and the Arab American Institute says the estimate is significantly lower than the actual Arab American population. The Census utilizes a separate question to identify Latino or Hispanic origin because it can be viewed as the heritage, nationality, lineage, or country of birth of the person or the person's parents or ancestors before arriving in the United States. People who identify as Hispanic or Latino may be of any race. For example, in Orange County, 17% of the ‘White Alone’ population identify as Hispanic or Latino.
While there is a shifting demographic within the entire population of Orange County, 5-year estimates from the American Community Survey * (2015-2019) indicate that, at least among the 65+ age group, Whites still comprise a majority of the population at 69%. The next largest racial group among older adults is Asian at 22.4%, followed by the Hispanic / Latino ethnicity at 15.7%.
The demographic shift in younger populations compared to older suggests that over the coming decades, the aging population of Orange County will also start to diversify further.
| Older Adult racial / ethnic identification | Total 65+ Count | % of 65+ Population |
|---|---|---|
| White Alone | 334,865 | 69.0% |
| Asian Alone | 108,588 | 22.4% |
| Hispanic* | 76,229 | 15.7% |
| Other Race Alone | 26,034 | 5.4% |
| Two or More Races | 7,639 | 1.6% |
| Black Alone | 5,923 | 1.2% |
| AIAN Alone | 1,563 | 0.3% |
| NHOPI Alone | 684 | 0.1% |
| Total Population | 485,296 |
*Because Hispanic is counted separately (see above), percentages in the table will not total to 100%. These data are drawn from ACS tables B01001A-I.

Racial and Ethnic Differences
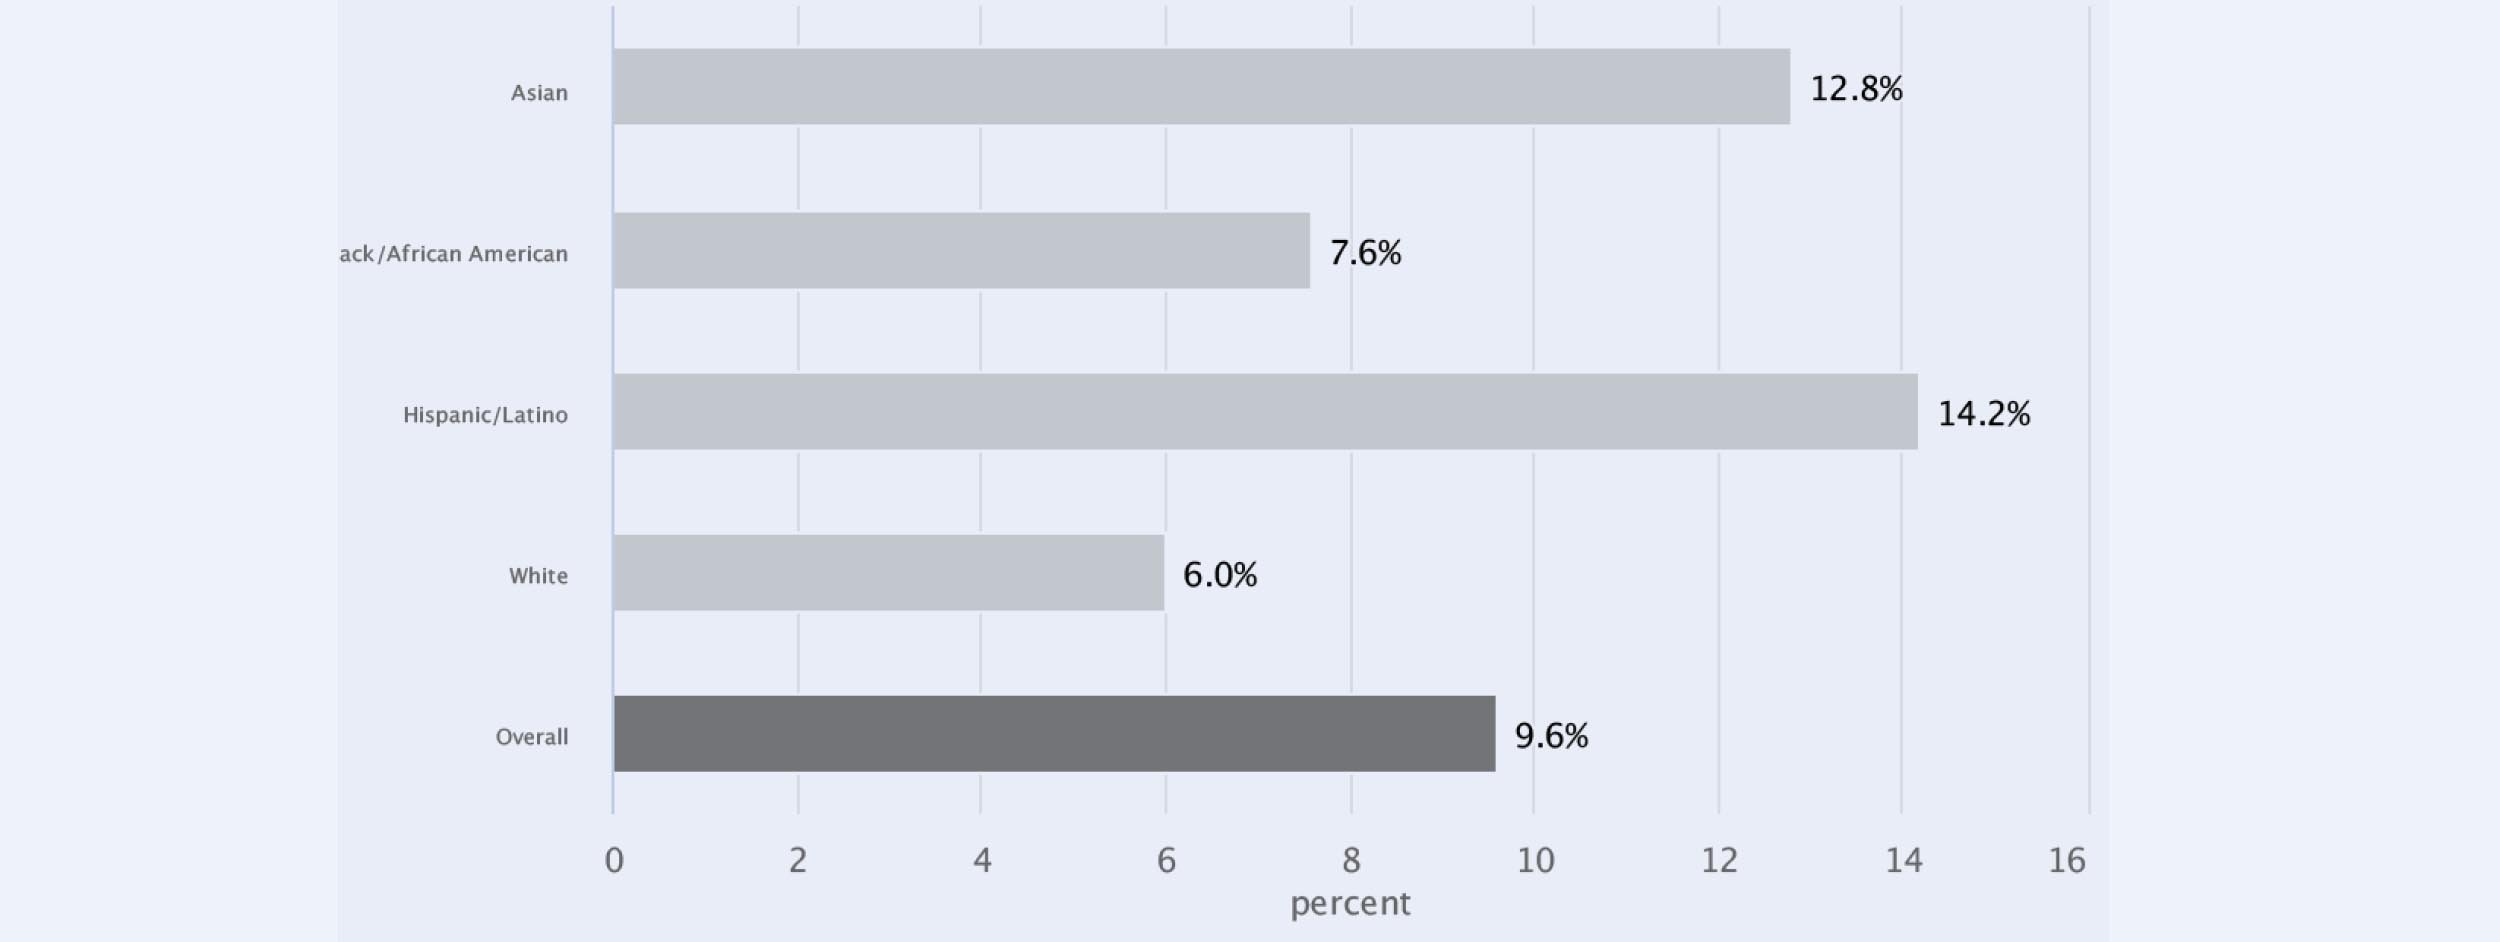
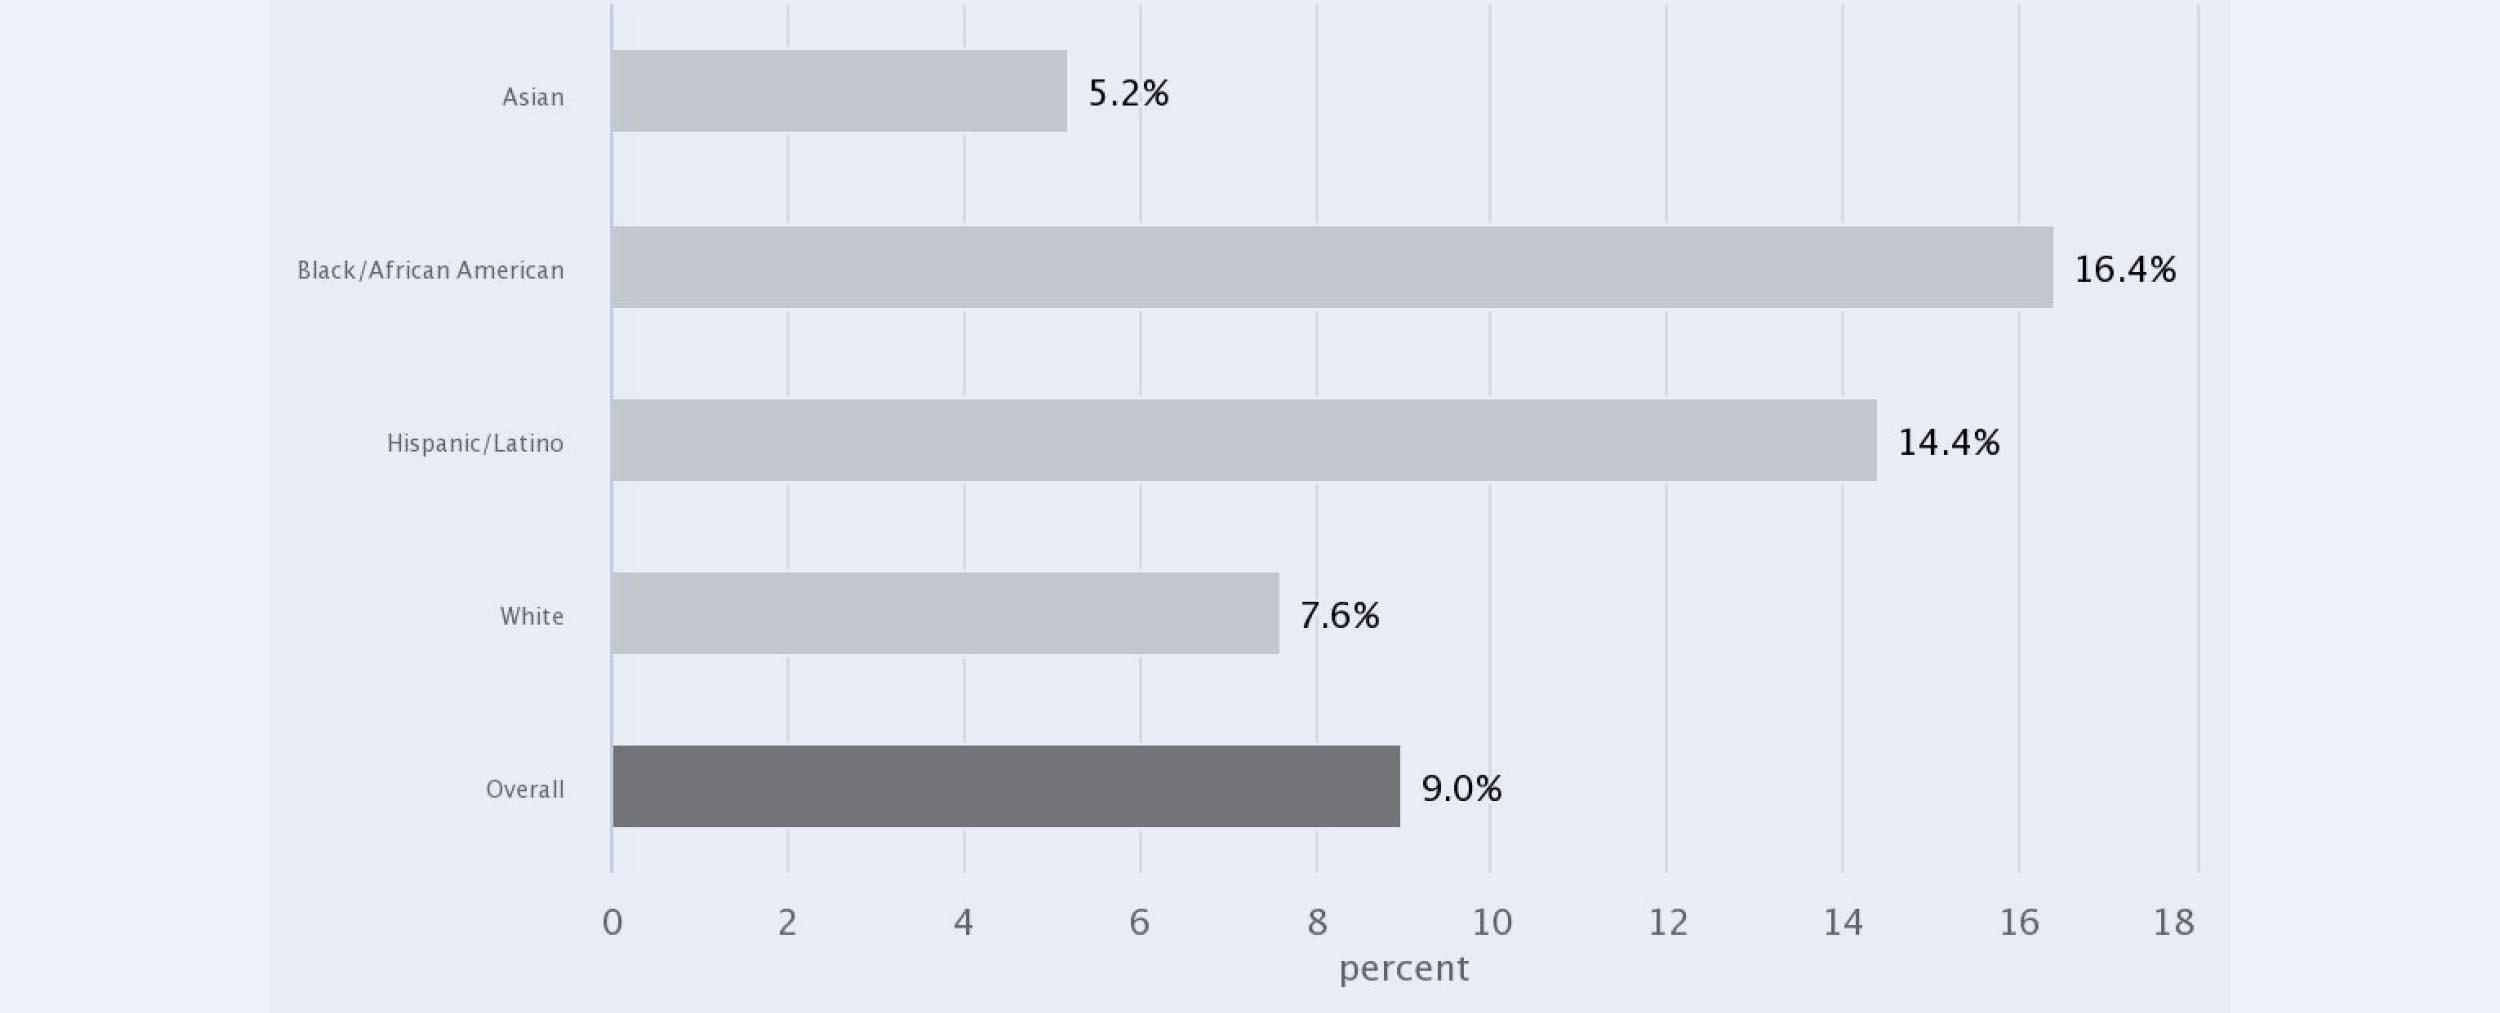
Racial and ethnic differences also exist in older adult economic security. Single Asian older adults have significantly lower rates of economic insecurity (5.2%) as compared to their couple counterparts (12.8%).
Black/African American single older adults face much higher rates of economic insecurity (16.4%) as compared to their couple counterparts (7.6%).
Hispanic / Latino single and couple older adults face comparable rates of economic insecurity (14.4% and 14.2%, respectively) that are consistently higher than other racial / ethnic groups and the overall rate (9.0% and 9.6%, respectively).
Single and couple White older adults have similar rates of economic insecurity (7.6% and 6.0%, respectively), with both being lower than the overall averages (9.0% and 9.6%, respectively).
These differences point to the broad impacts that demographic factors have related to the experience of older adults because poverty underlies so many problems that they face.
Elder Couples Living Below The Elder Economic Security Index By Race/Ethnicity in Orange County

Single Elders Living Below The Elder Economic Security Index By Race/Ethnicity in Orange County

Poverty
Poverty looms large as a factor affecting the lives of older adults. It affects access to good healthcare, technology, transportation, food, and almost every other aspect of life. While the median household income for the OC population of 65+ residents is $63,728,there is a large proportion of the older adult population that experiences poverty.
For example, there are 553 Census Tracts in Orange County. The poorest has a median income of $12,660 and the wealthiest has a median income of $ 234,773. The middle 50% of the tracts have a median income between $48,125 and $85,192.
As a point of reference, the federal poverty level for 2021 (from the Federal Register) is presented in the following table. (Previous years are not substantially different.)
| Household/Family Size | 100% | 150% | 200% |
|---|---|---|---|
| 1 | $12,880 | $19,320 | $25,760 |
| 2 | $17,420 | $26,130 | $34,840 |
This is an exceptionally low income level given the cost of living in Orange County. And these estimates are likely incorrect. The ACS 2019 data table S1703 shows that about 15.3% of the OC population is 65 years of age or older, with 3.5% of them living on an income that is less than half of the federal poverty level ($6,245 for singles or $8,455 for a family of 2). Further, 8.7% of the 65+ population lives at less than 100% of the poverty level ($12,490 for singles or $16,910 for a family of 2). And a total 12.4% of the 65+ population lives on 125% of the poverty level ($15,612 single or $21,137 couple).
ACS 5 year estimates suggest that 9.2% of 65+ in OC live below the federal poverty level.
Why Being 200% Above the Poverty Indicator Matters
A study by The Urban Institute (2017) found that those in the U.S. with an income of less than 200% of the federal poverty level are likely to be food insecure.
“Measuring a family’s ability to meet basic needs can provide a broader understanding of well-being than income-based poverty indicators."
- Even with full employment, nearly 40% of adults report that they had trouble meeting at least one basic need for food, health care, housing, or utilities in 2017
- Adults are more likely to report material hardship if they are in poor health or have multiple chronic conditions
- Rates of hardship are elevated for adults who are young, female, black or Hispanic, less educated, and/or living with children
- Adults who report one type of hardship often report other types as well
- Among adults reporting hardship, 60.2% report two or more hardships; and 34.7% report three or more hardships.
According to OC Healthier Together, a whopping 25.5% or 809,801 of all Orange County residents (2020 census) live below the 200% poverty level in Orange County .
As the below indicates, approximately 22.4% or 107,070 older adults age 65 and over live below 200% of the federal poverty level in Orange County. Poverty levels vary by age group, with poverty highest among 75+ compared to the 65-74 age group. Poverty is about 3.6% higher among 75+ compared to 65-74 when using <100% of poverty level. It is about 6.7% higher among 75+ compared to 65-74 when using 200% of the poverty level.
| 65+ | 65-74 | 75+ | ||||
|---|---|---|---|---|---|---|
| Estimate | Percent of all 65+ | Estimate | Percent of 65-74 | Estimate | Percent of 75+ | |
| < 100% of poverty level | 41,503 | 8.7% | 19,484 | 7.1% | 22,019 | 10.7% |
| 100 - 200 % of poverty level | 65,567 | 13.7% | 29,414 | 10.8% | 36,153 | 17.5% |
| Total < 200% of poverty level | 107,070 | 22.4% | 48,898 | 17.9% | 58,172 | 28.2% |
And the number of older adults with low incomes is growing. CHHS data estimates that there are 70,900 adults over age 60 living in OC who were ‘low income’ in 2020. That number was up from 68,900 in 2019.
Poverty or income level itself may be a poor indicator of the lived experience of older adults. One way to exemplify this is to compare income to a standard expenditure like housing costs. 32% of homeowners aged 65+ in OC spend more than 30% of their household income on housing costs in 2019. This reduces the amount of money that can be spent on food, medication, healthcare, or other costs.
Other older adults have a very low level of income and very low housing costs because they may have paid off their house and benefit from Proposition 13’s property tax rate limits.
A More Relevant Metric: Elder Economic Security Index
Alternative measures of economic wellness for older adults may be better indicators than simple poverty measures. The Elder Economic Security Index considers local costs for housing, health care, food, and transportation. It provides a more complete estimate of the financial condition of older adults.
According to the 2019 CHIS estimates, 25.6% (or 124,236) of older adults in OC have a household income below the Elder Economic Security Standard Index (2019) (485,296 * 0.256 = 124,236)
This is substantial growth as earlier 2015 CHIS estimates estimates put 9.0% of single elders and 9.6% of elderly couples in OC living below the Elder Economic Security index.
Single elders living below the Elder Economic Security Index by Age

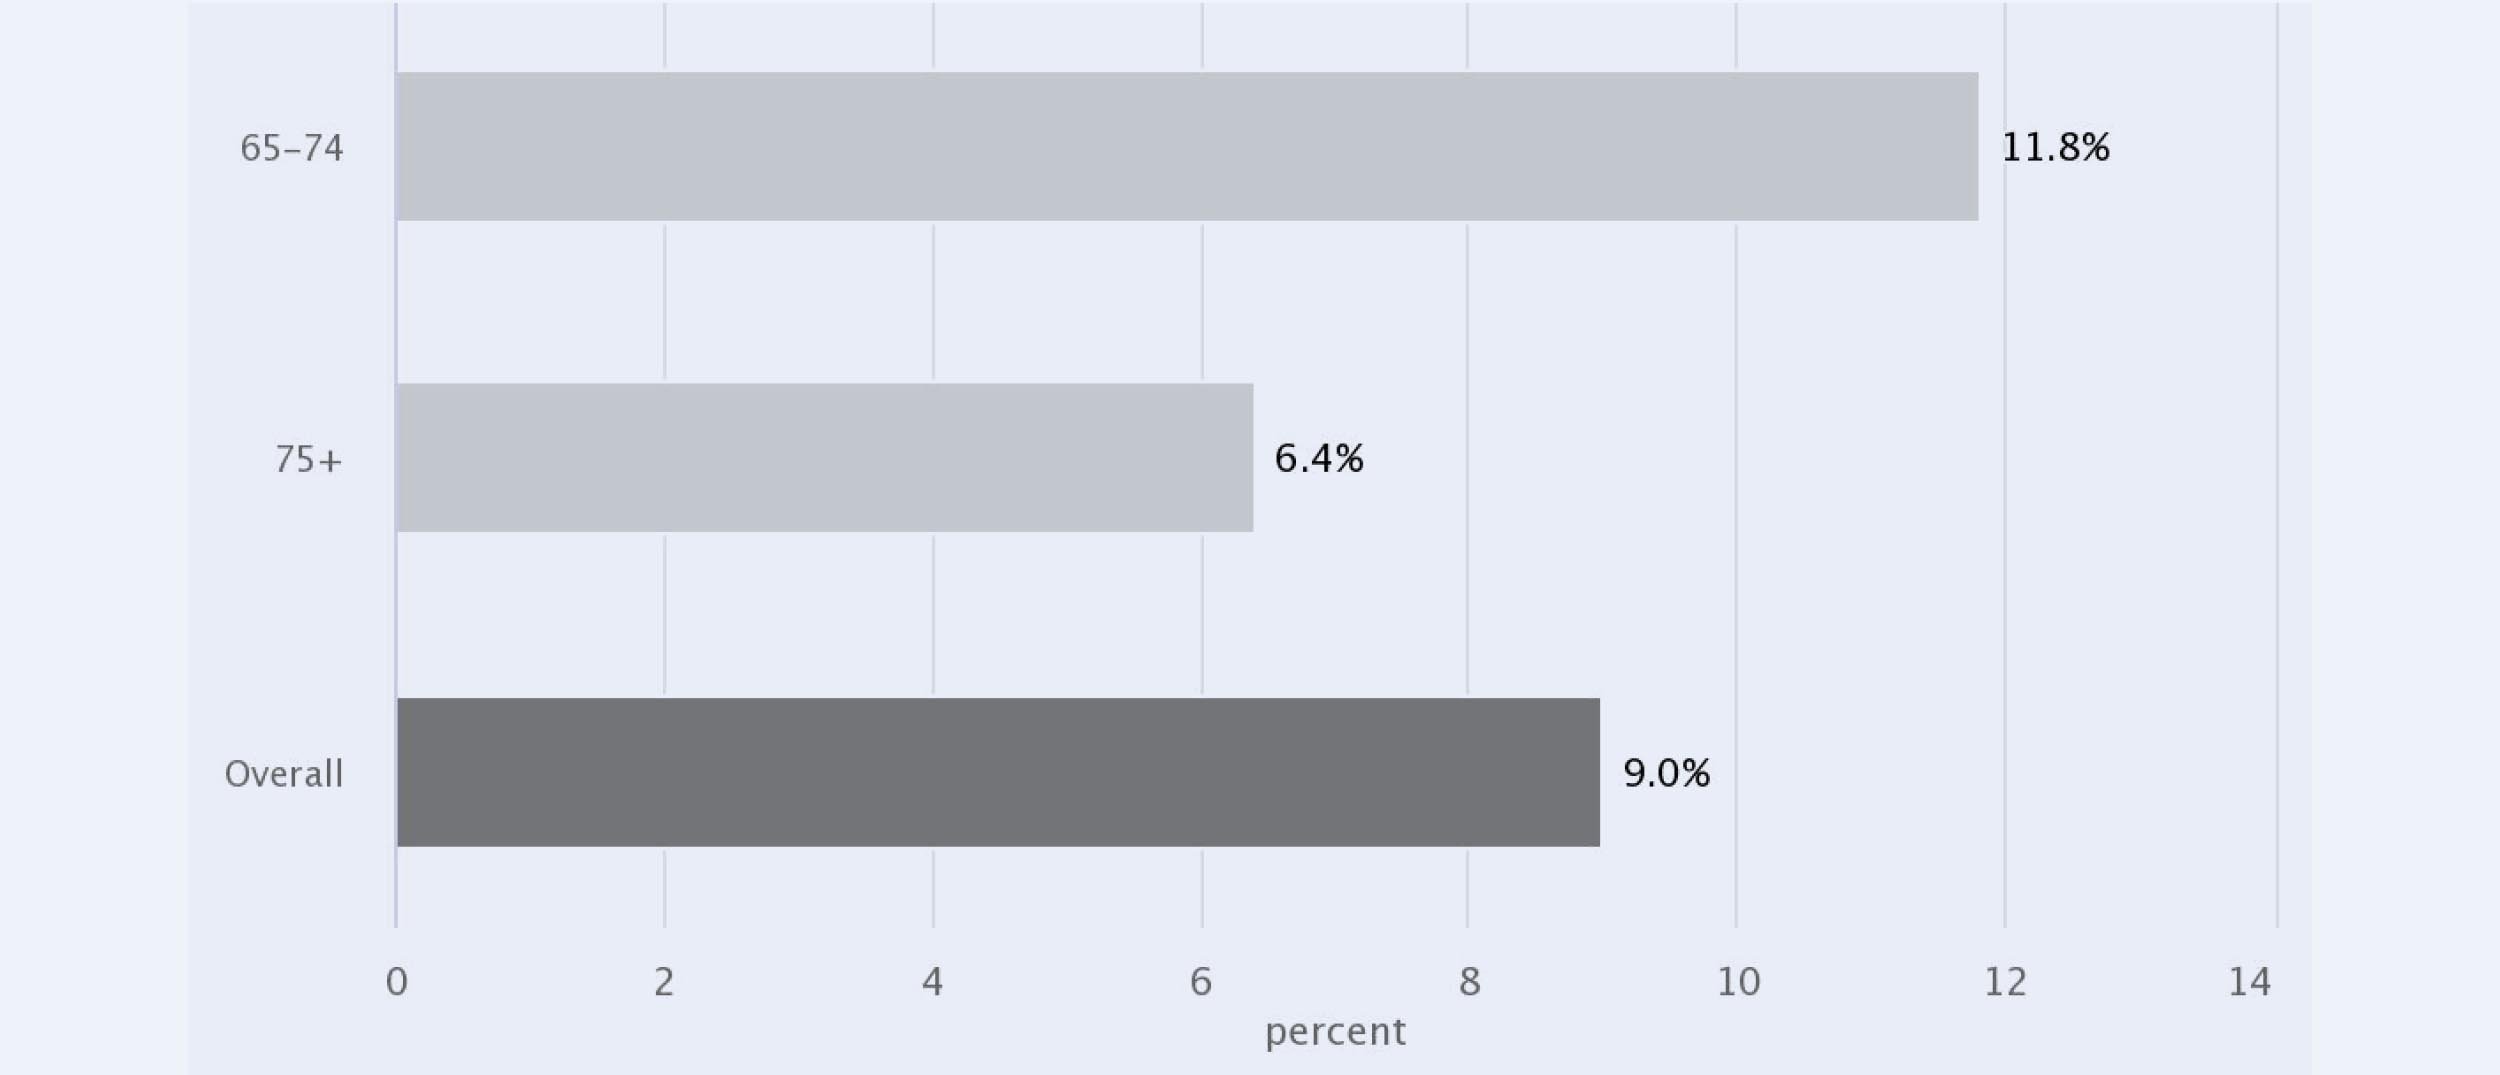
Elder couples living below the Elder Economic Security Index by Age

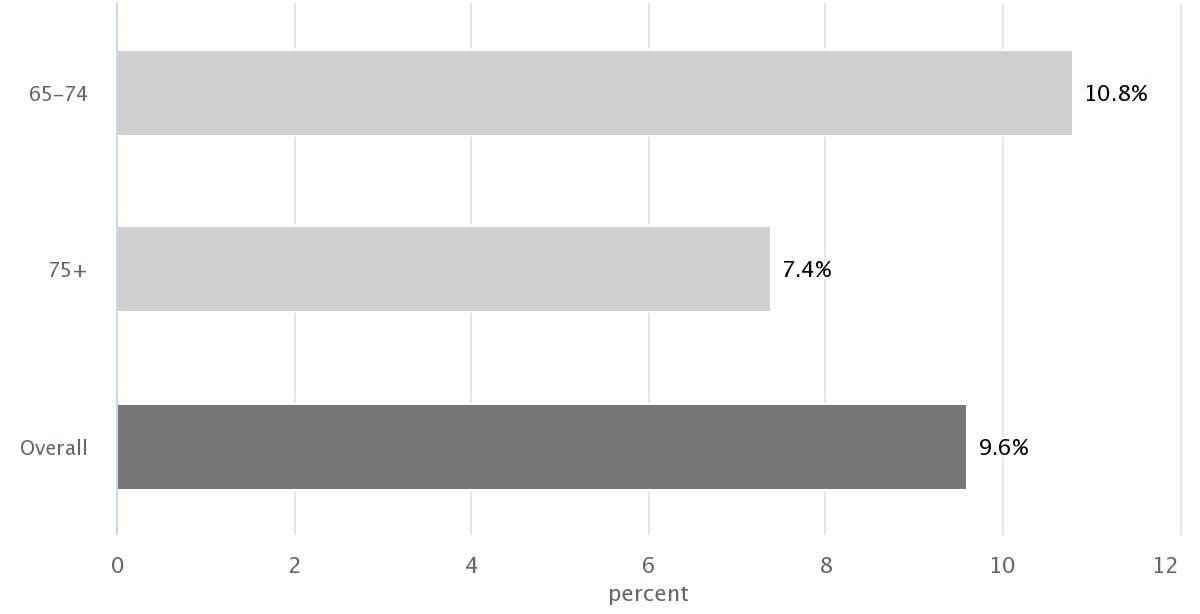
In both instances, the 75+ age group is estimated to experience lower levels of economic insecurity than the 65-74 year old age group. However, couples in the 65-74 age group experience lower levels of economic insecurity than their single peers (10.8% vs 11.8%), while single older adults in the 75+ age group experience less economic insecurity than their couple peers (6.4% vs 7.4%).
Gender Differences
Economic insecurity is much more pronounced among single older adult males.
Single elders living below the Elder Economic Security Index by Gender

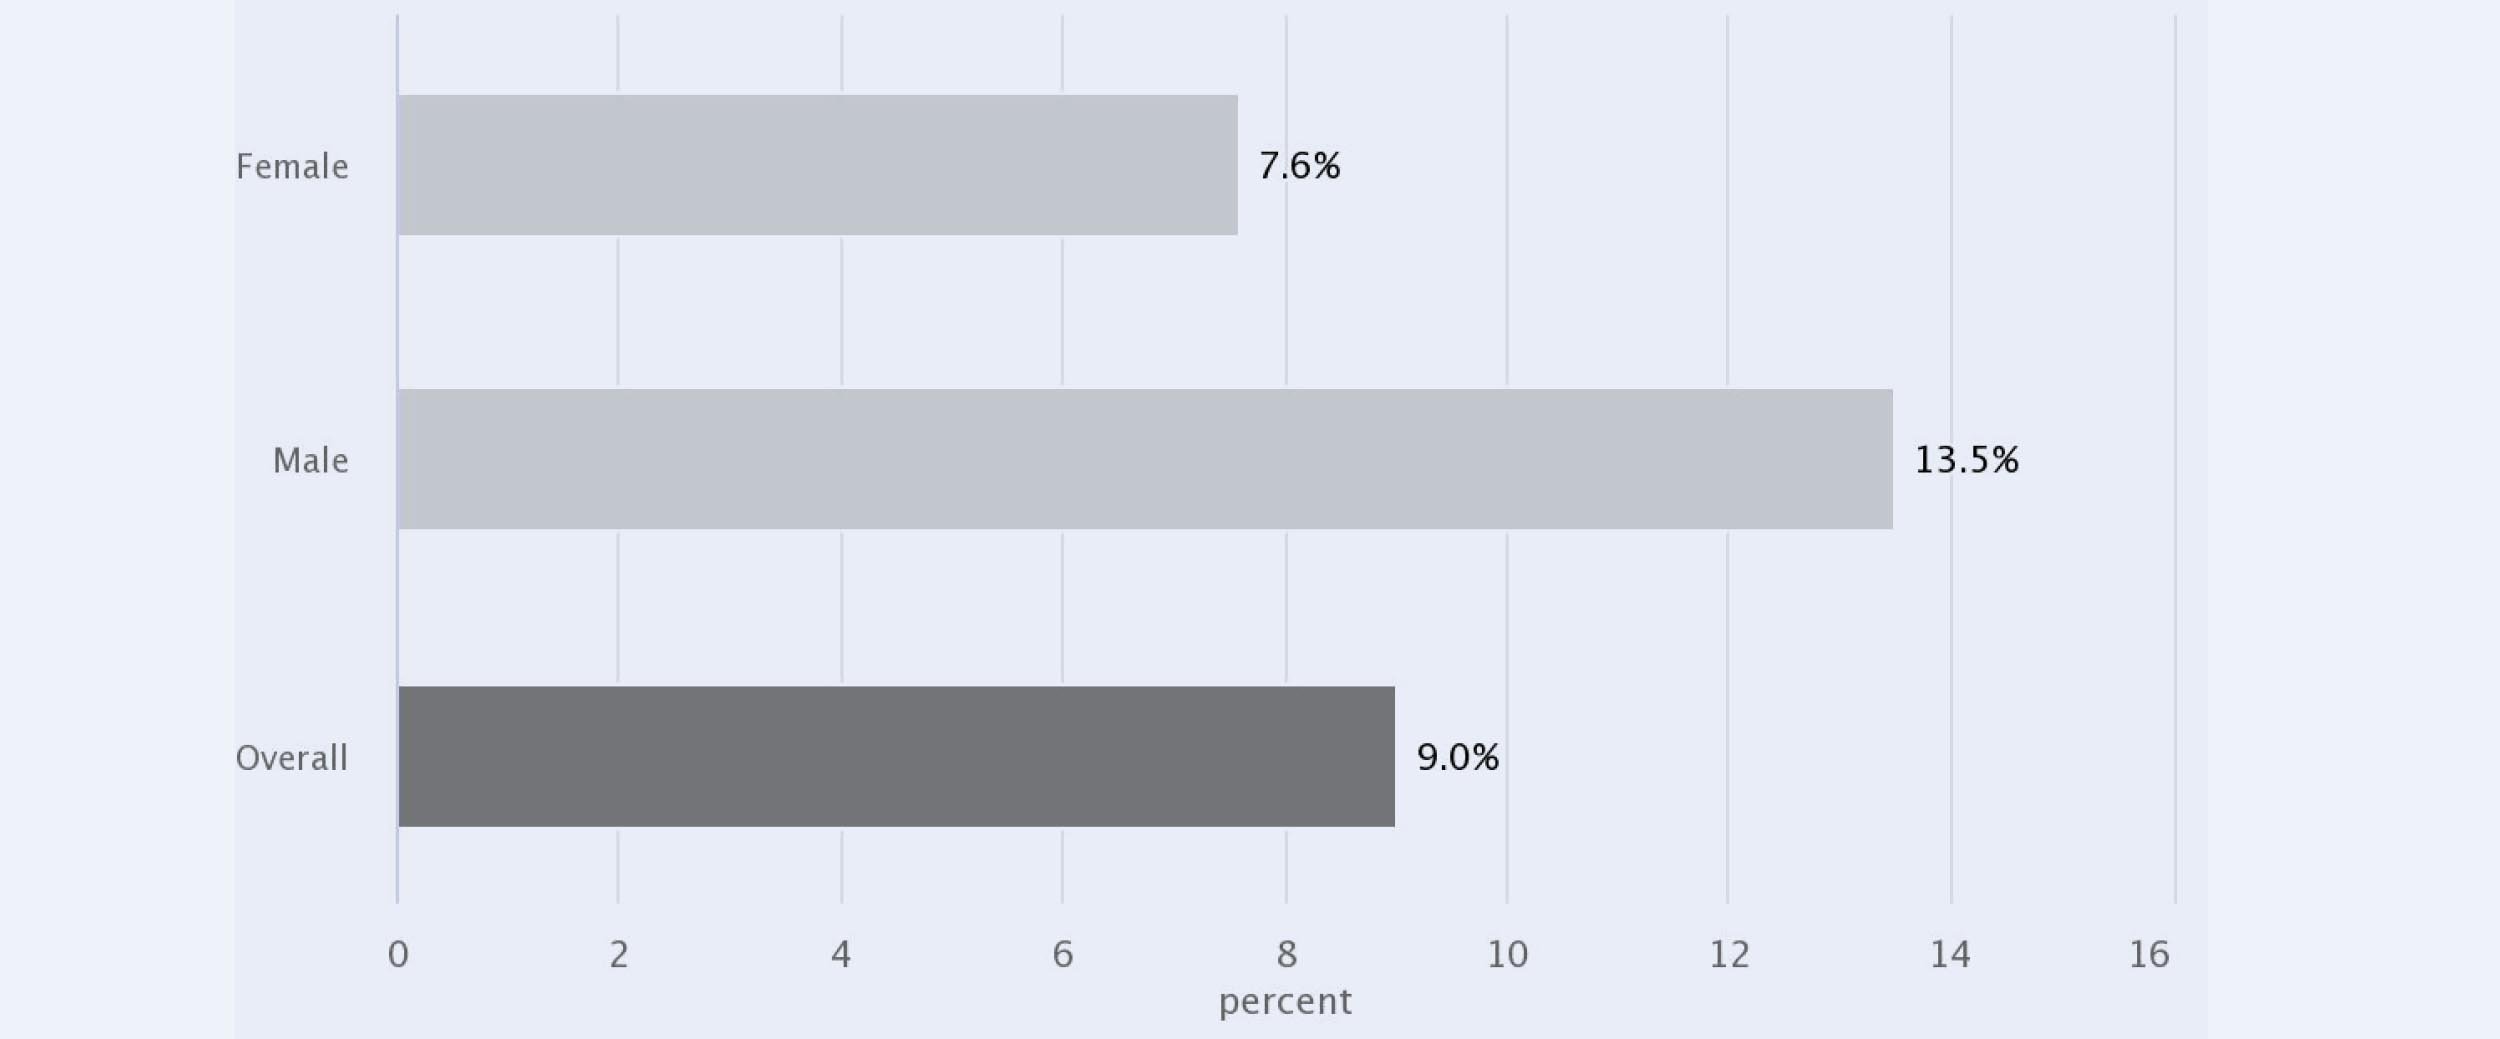
Single male elders experience economic insecurity at a higher rate than any other group, at 13.5%. The lower levels of couple economic insecurity suggest that economic difficulties are accentuated among males once they live alone as compared to within a couple relationship.
Veterans
Due to the high number of Vietnam War era veterans (36,000), Orange County has the fourth-largest population of older veterans in California. It is home to about ~130,000 returned servicemen and women.
According to the American Community Survey (ACS) 58% of the 130,000 veterans who live in Orange County are age 65+ (81,258 individuals).

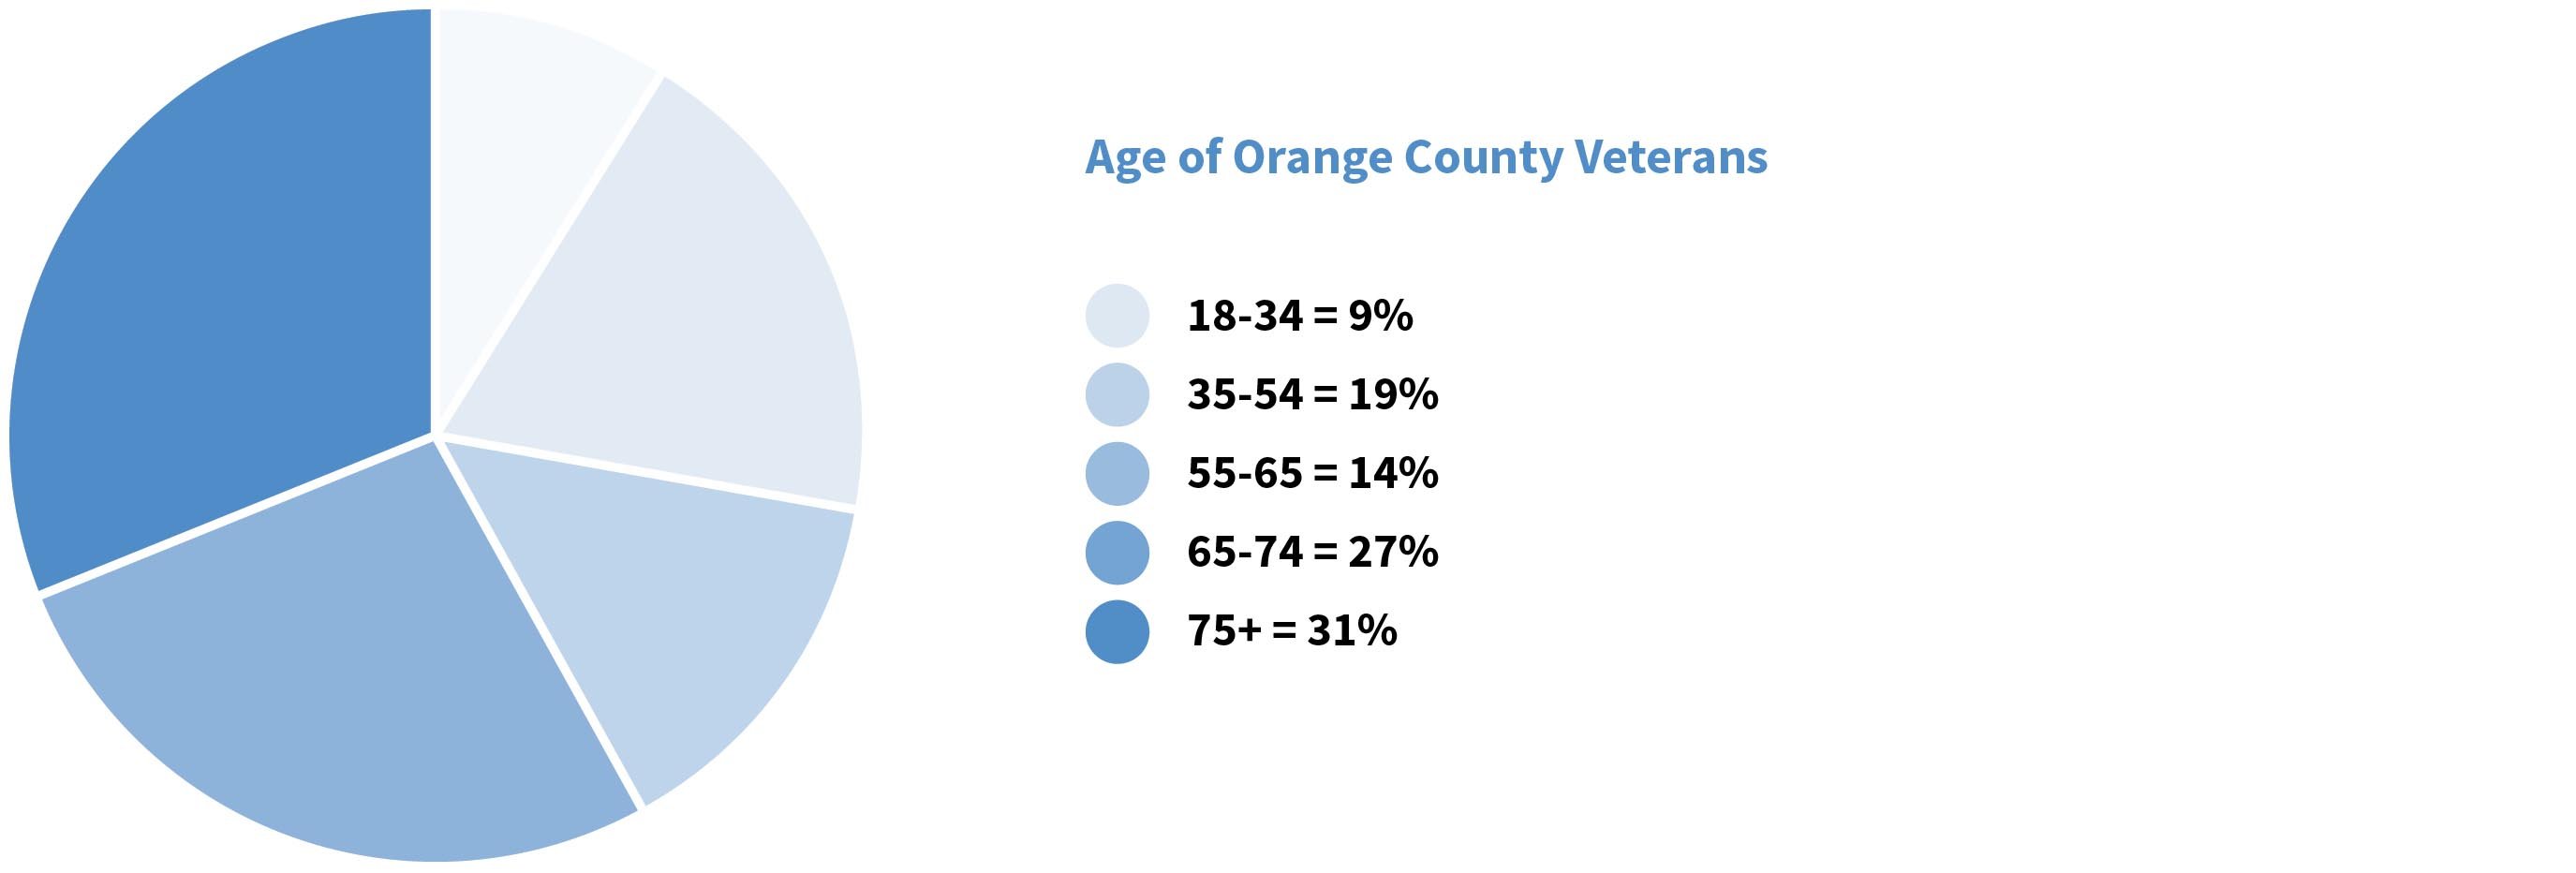
Source: Livestories – Orange County Veteran Demographics


Source: Livestories – Orange County Veteran Demographics
While the veterans are fairly evenly distributed throughout the county, there are marked concentrations of veterans in Seal Beach (18%) and Placentia (35.1%) where there are facilities dedicated to helping them. (Seal Beach is adjacent to Long Beach where Veterans Administration medical facilities are located.)
An estimated 27% of veterans of all ages (35,100) are living with a disability in OC. Since 93% of them are male, this presents its own problems for the 9,000 female veterans.
“There’s no women veterans (resources) down here in Orange County. We have to go up to Long Beach for it. And then Long Beach refers you to West LA. And that’s far.”