Data Overview
How Many People are Food Insecure in Orange County?
In pre-pandemic Orange County (2016-2018), the California Health Interview Survey estimated the rate of food insecurity for low-income adults aged 65 years and over to be 29.4%. This figure included households with an income of 200% of the Federal Poverty Level (FPL) - as determined by the Urban Institute 2017. This is especially true of Black households (21.7%) and Hispanic households (17.2%) which experience two and three times the nutrition insecurity compared to 7.1% of White households as a national average.
Food insecurity survey questions were only asked of adults whose income was less than 200% of the Federal Poverty Level (FPL) because food insecurity is an economic and social indicator of the health of a community. Poverty and unemployment are frequently predictors of food insecurity in the United States. A survey commissioned by the Food Research and Action Center (FRAC) found that one in four Americans worries about having enough money to put food on the table in the next year. Food insecurity is associated with chronic health problems in adults including diabetes, heart disease, high blood pressure, hyperlipidemia, obesity, and mental health issues including major depression.
Because this figure is obtained by questionnaire, it's possible that these self-reported figures underestimate the scope of the issue for personal reasons such as shame, guilt, fear or pride. Individuals may also play down their lack of food as temporary or unimportant. Some may have become accustomed to eating fewer meals, or not view eating less as a problem. They may also be getting calories, but not tracking their nutrition intake in comparison to an adequate and healthy diet for someone of their age or health status. Further, this data does not address individuals who live at greater than 200% of the FPL and who may be experiencing food insecurity due to lack of adequate income, mobility, isolation, health and cognitive impairments and other considerations.
Feeding America estimates that 113,468 older adults are food insecure in OC. However, using the 29.4% food insecurity rate referenced above for those aged 65+ living below 200% of the FPL results in a slightly higher estimate of 142,677 as noted in the table below
Older Adults (65+) living at less than 200% of the Poverty Level in Orange County
| Age Group | No. of people OC 2020 |
|---|---|
| 65 to 74 years | 274,232.00 |
| 75 to 84 years | 148,490.00 |
| 85 years and over | 62,574.00 |
| TOTAL | 485,296 |
Source: ACS Supplemental Poverty Measure 2020; US Census *29.4% food insecurity rate of 485, 296 = 142,677
If we expand the possible age range to include the 196,701 people aged 60 to 65 who live below 200% of the FPL, we begin to understand the wave of food insecurity facing older residents of Orange County. Using that same 29.4% food insecurity rate for those living below 200% of FPL, it increases our estimate of the number of older adults facing food insecurity by 58,571 individuals, and brings the total to just over 200,000 people.
| Age | No. of People in OC 2020 |
|---|---|
| 60 to 64 years | 196,701.00 |
| 65 to 74 years | 274,232.00 |
| 75 to 84 years | 148,490.00 |
| 85 years and over | 62,574.00 |
| TOTAL | 681,997 |
29.4% of 681,997 = 200,507 of 60+
Thus, it is fair to estimate that in Orange County, there are between 113,000 and 200,000 older residents who may not be getting enough to eat due to economic reasons. This difference of 80,000+ individuals is a result of how we define older adults (age 60+ or 65+) and whether we include those nearing retirement age in our estimates about how poverty affects food insecurity.
Impact of Global Pandemic
Figures from the Office on Aging Orange County show there was a 63% overall increase in senior meals between 2019-20 & 2020-21. It’s likely the pandemic revealed latent unmet demand for food among seniors.
It’s probable that these figures won’t fall in the coming years. In their report The Impact of the Coronavirus on Food Insecurity in 2020 & 2021, Feeding America says: “After the Great Recession, it took nearly ten years, until 2018, for food insecurity to return to pre-recession levels, and even then, 37 million people were still at risk of hunger.” The same may apply to elevated levels of food insecurity observed during Covid-19. In March 2019, Meals on Wheels Orange County, Age Well Senior Services and the City of Irvine rapidly converted their pre-pandemic dine-in lunch programs at partnering senior and community centers to frozen Grab & Go meals. Whereas seniors previously were served one hot meal each weekday, they now picked up frozen entrées that they could eat in the safety of their homes. The increase in meals was unprecedented. For example, Meals on Wheels Orange County notes that while they had averaged about a thousand hot meals each weekday previously, they quickly began providing an average of 6,000 frozen meals each weekday, a 600% increase. Even now, the nonprofit continues to serve an average of 4,000 each weekday. This reflects not only the additional need that older adults have faced because of the pandemic crisis, but also may signal that some may have experienced some level of nutritional distress prior to the pandemic.
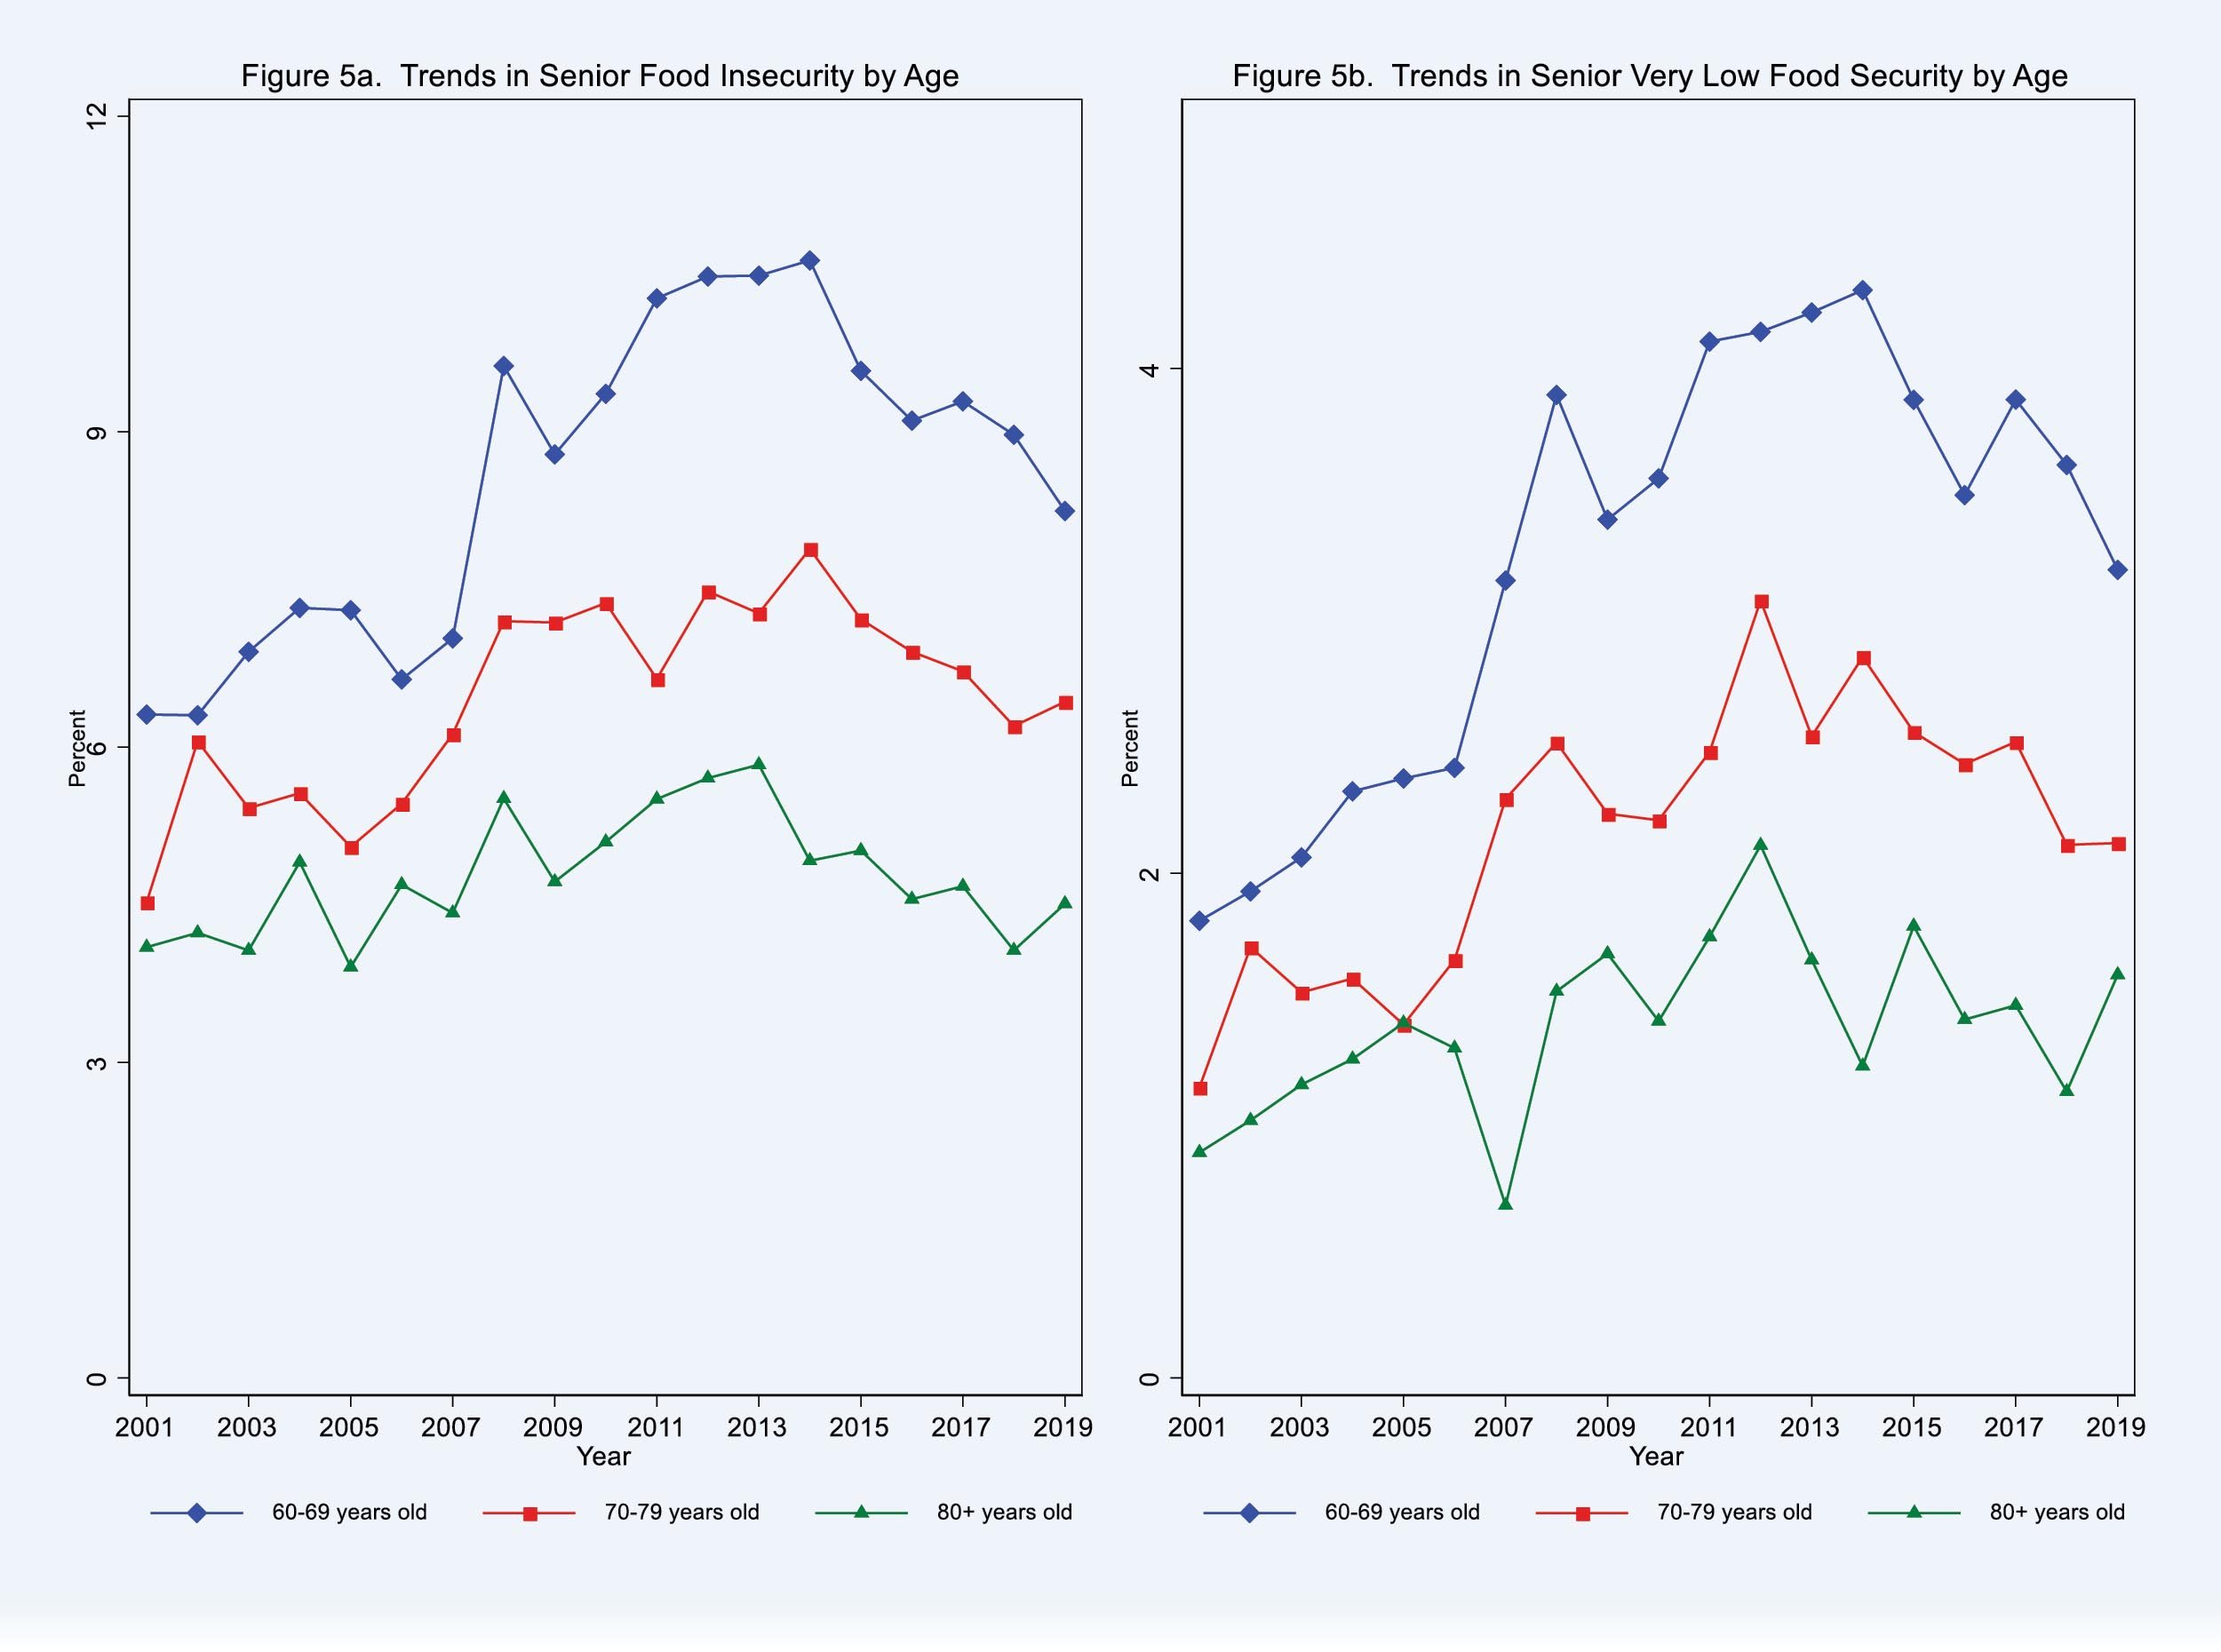
Further, there are differences in the level of food insecurity by age group. The State of Senior Hunger report from Feeding America shows the stark difference in food insecurity rates for different age groups of older adults nationally. As indicated in the following graphs, overall food insecurity rates in the US are highest among the 60-69 age group and lowest among the 80+ age group.
Feeding America “State of Senior Hunger in America” by Age: CalFresh and Poverty

In Orange County, a review of poverty levels by age group indicates 9.0% of households in OC have income below the poverty level. As noted in the table below, 29.3% of households that receive CalFresh (known nationally as SNAP) live below the poverty level ($12,490 for singles or $16,910 for a family of 2) whereas 70.7% live above the poverty level by some amount. The median income of a household receiving SNAP benefits is $40,220.
| Orange County | Percent of Orange County | Households receiving food stamps/SNAP | Percent households receiving food stamps/SNAP | |
|---|---|---|---|---|
| Households | 1,044,280 | 51,112 | 4.90% | |
| With one or more people in the household 60 years and over | 442,385 | 42.40% | 21,803 | 42.70% |
| No people in the household 60 years and over | 601,895 | 57.60% | 29,309 | 57.30% |
| Poverty Status in the Past 12 Months | ||||
| Below poverty level | 94,025 | 9.00% | 14,956 | 29.30% |
| At or above poverty level | 950,255 | 91.00% | 36,156 | 70.70% |
| Disability Status | ||||
| With one or more people with a disability | 206,846 | 19.80% | 19,213 | 37.60% |
| With no persons with a disability | 837,434 | 80.20% | 31,899 | 62.40% |

Dark green indicates 40% or higher of older adults living in poverty. (left) Green and blue dots indicate food pantries. (right)
Impact of Food Insecurity
The CDC observed that the greatest risk from food insecurity is malnutrition – an easily modifiable health risk which, if left unattended, leads to chronic disease. For older adults the risks of food insecurity are:
- 60% more likely to suffer congestive heart failure or a heart attack
- 50% more likely to have diabetes
- 14% more likely to be hypertensive
- 3x as likely to suffer depression.
The Health and Nutrition Examination Survey (HANES) longitudinal study of adults aged 25-74 indicated that 16% of older adults consumed fewer than 1000 calories per day — a statistic that would place them at high risk for undernutrition - the cause of half of all chronic diseases affecting older Americans.
To put that into perspective, in 2018 one-third of all deaths in the U.S. were from heart disease or stroke. This costs $214 billion per year in medical expenses, $138 billion in lost productivity and incalculable heart ache for the family and loved ones. In 2018 that represented 868,000 Americans at an average cost of $246,500 per person in healthcare costs alone.
Prevalence and determining factors
Feeding America estimated that the 2019 pre-COVID food insecurity rate in Orange County was 8.3% for all individuals (all ages), or approximately 264,340 people, and the annual budget shortfall to feed them was $158,634,000.
The social determinants which put people of all ages at highest risk of food insecurity are:
- Elderly people who live alone, or are socially isolated
- The unemployed and those living in poverty
- Single parent households
- Black or Hispanic households
The risk to all of them increases further when two or more elements are combined, or if they lived in either an urban or rural area, rather than the suburbs.
OCSPA Geo Maps
The OCSPA Geo Maps are particularly useful for interrogating the data about food supply for older adults in Orange County.
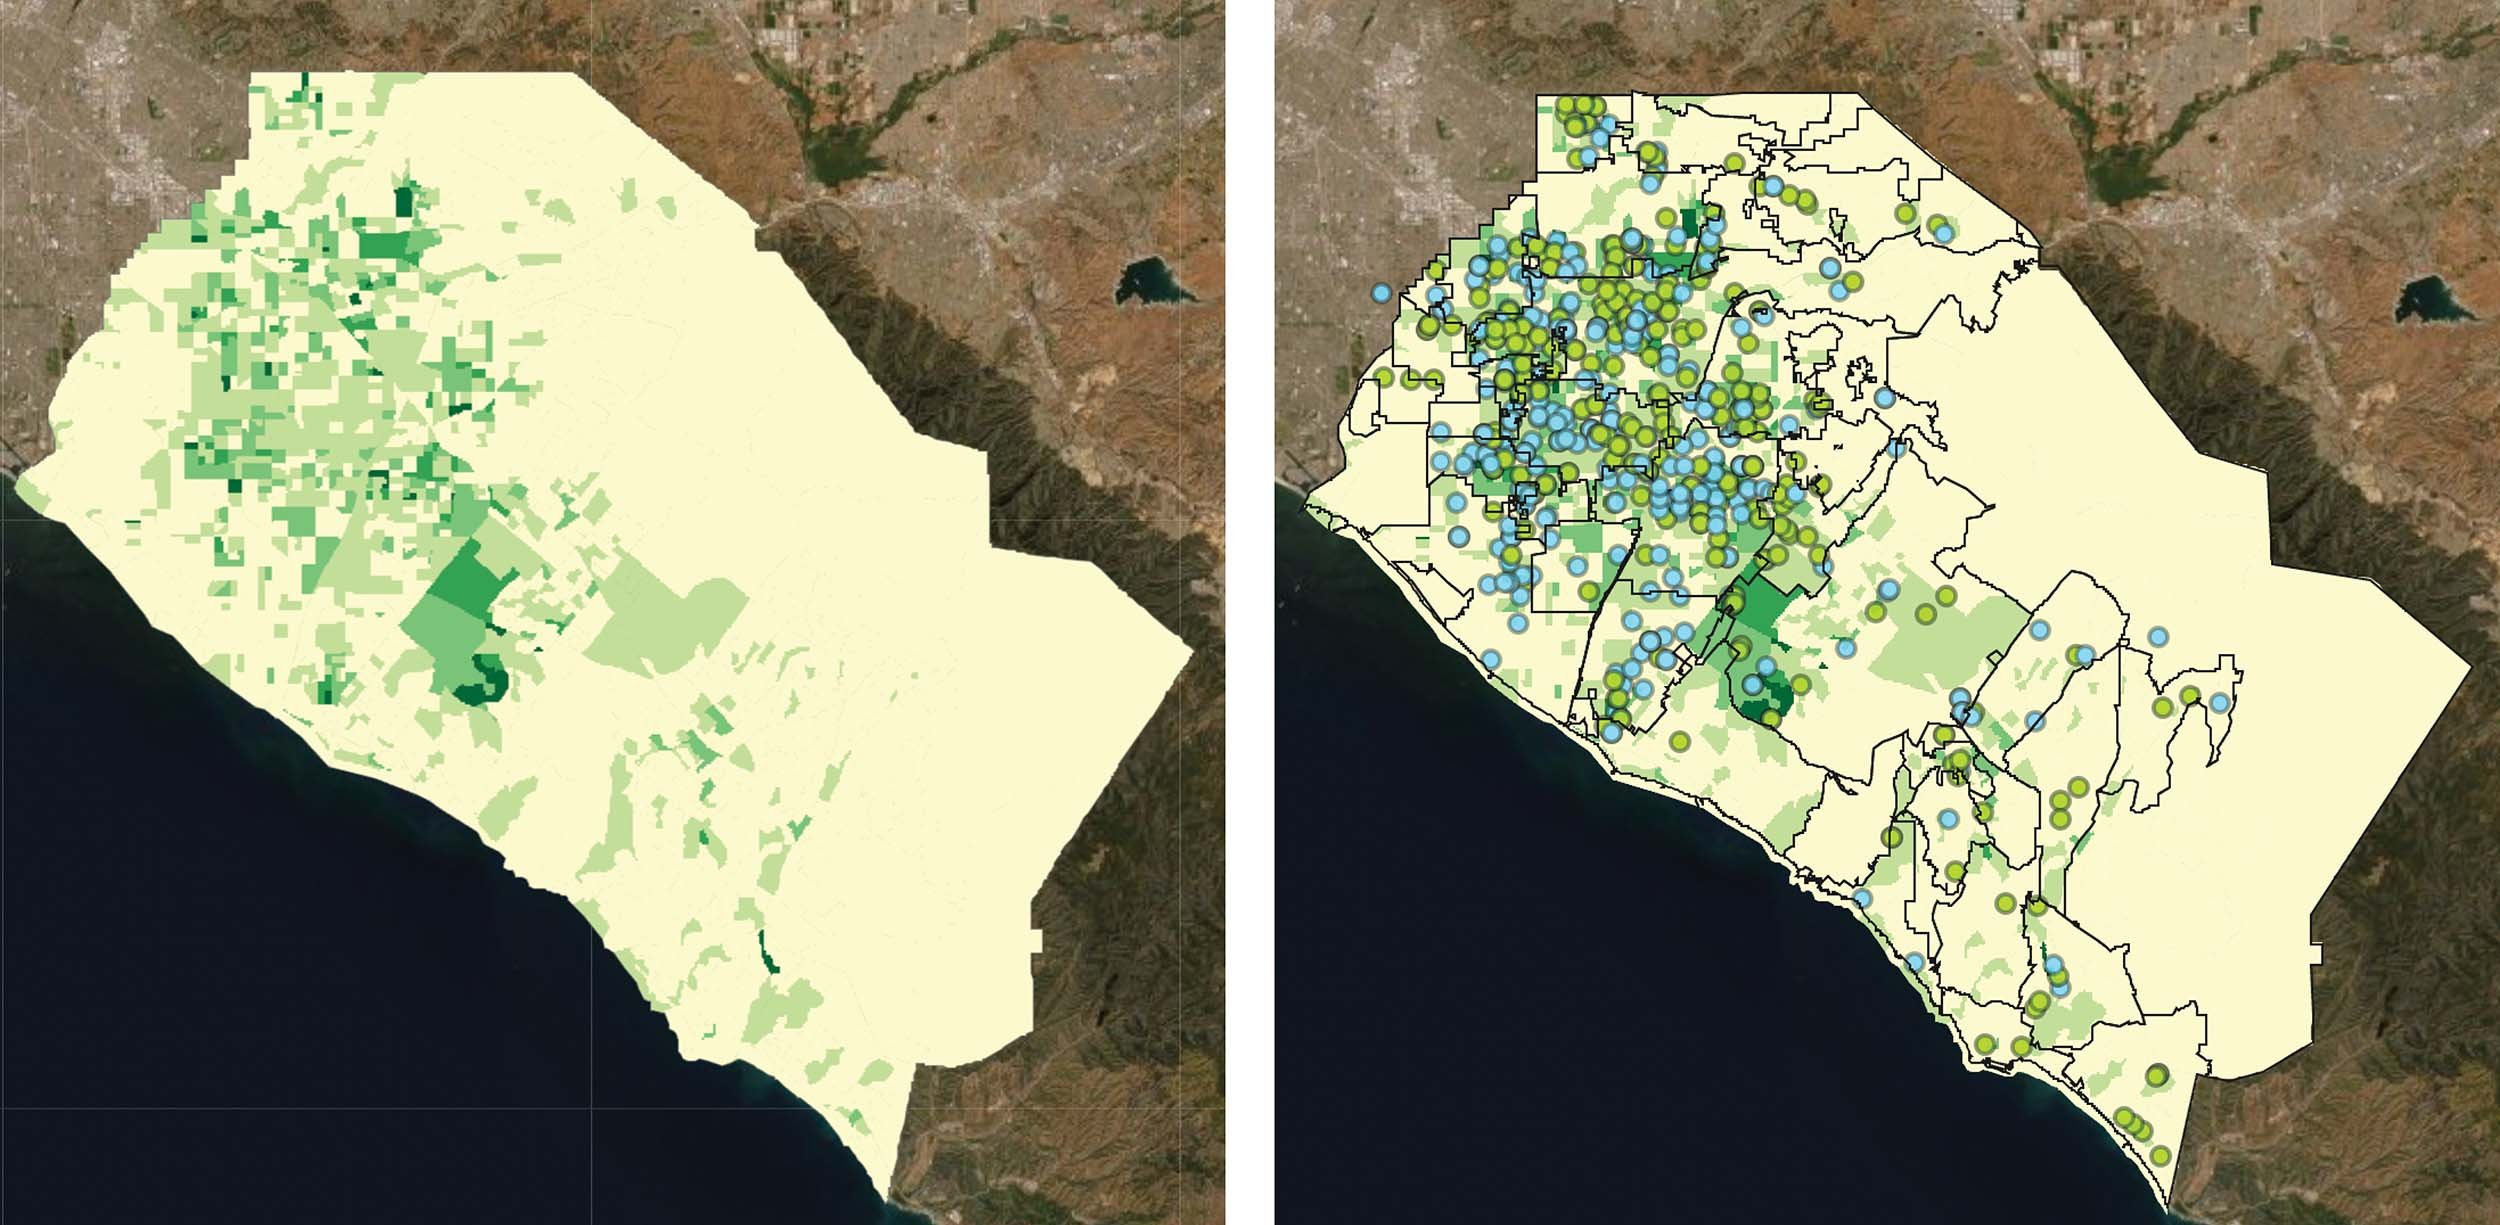
For instance, using 600 census tracts for which we have client data for congregate meals (meals served at senior and community centers through Orange County Office on Aging providers Meals on Wheels OC, Age Well Senior Services, and the City of Irvine) and mapping them against client data, we can see how clients are distributed throughout the county.
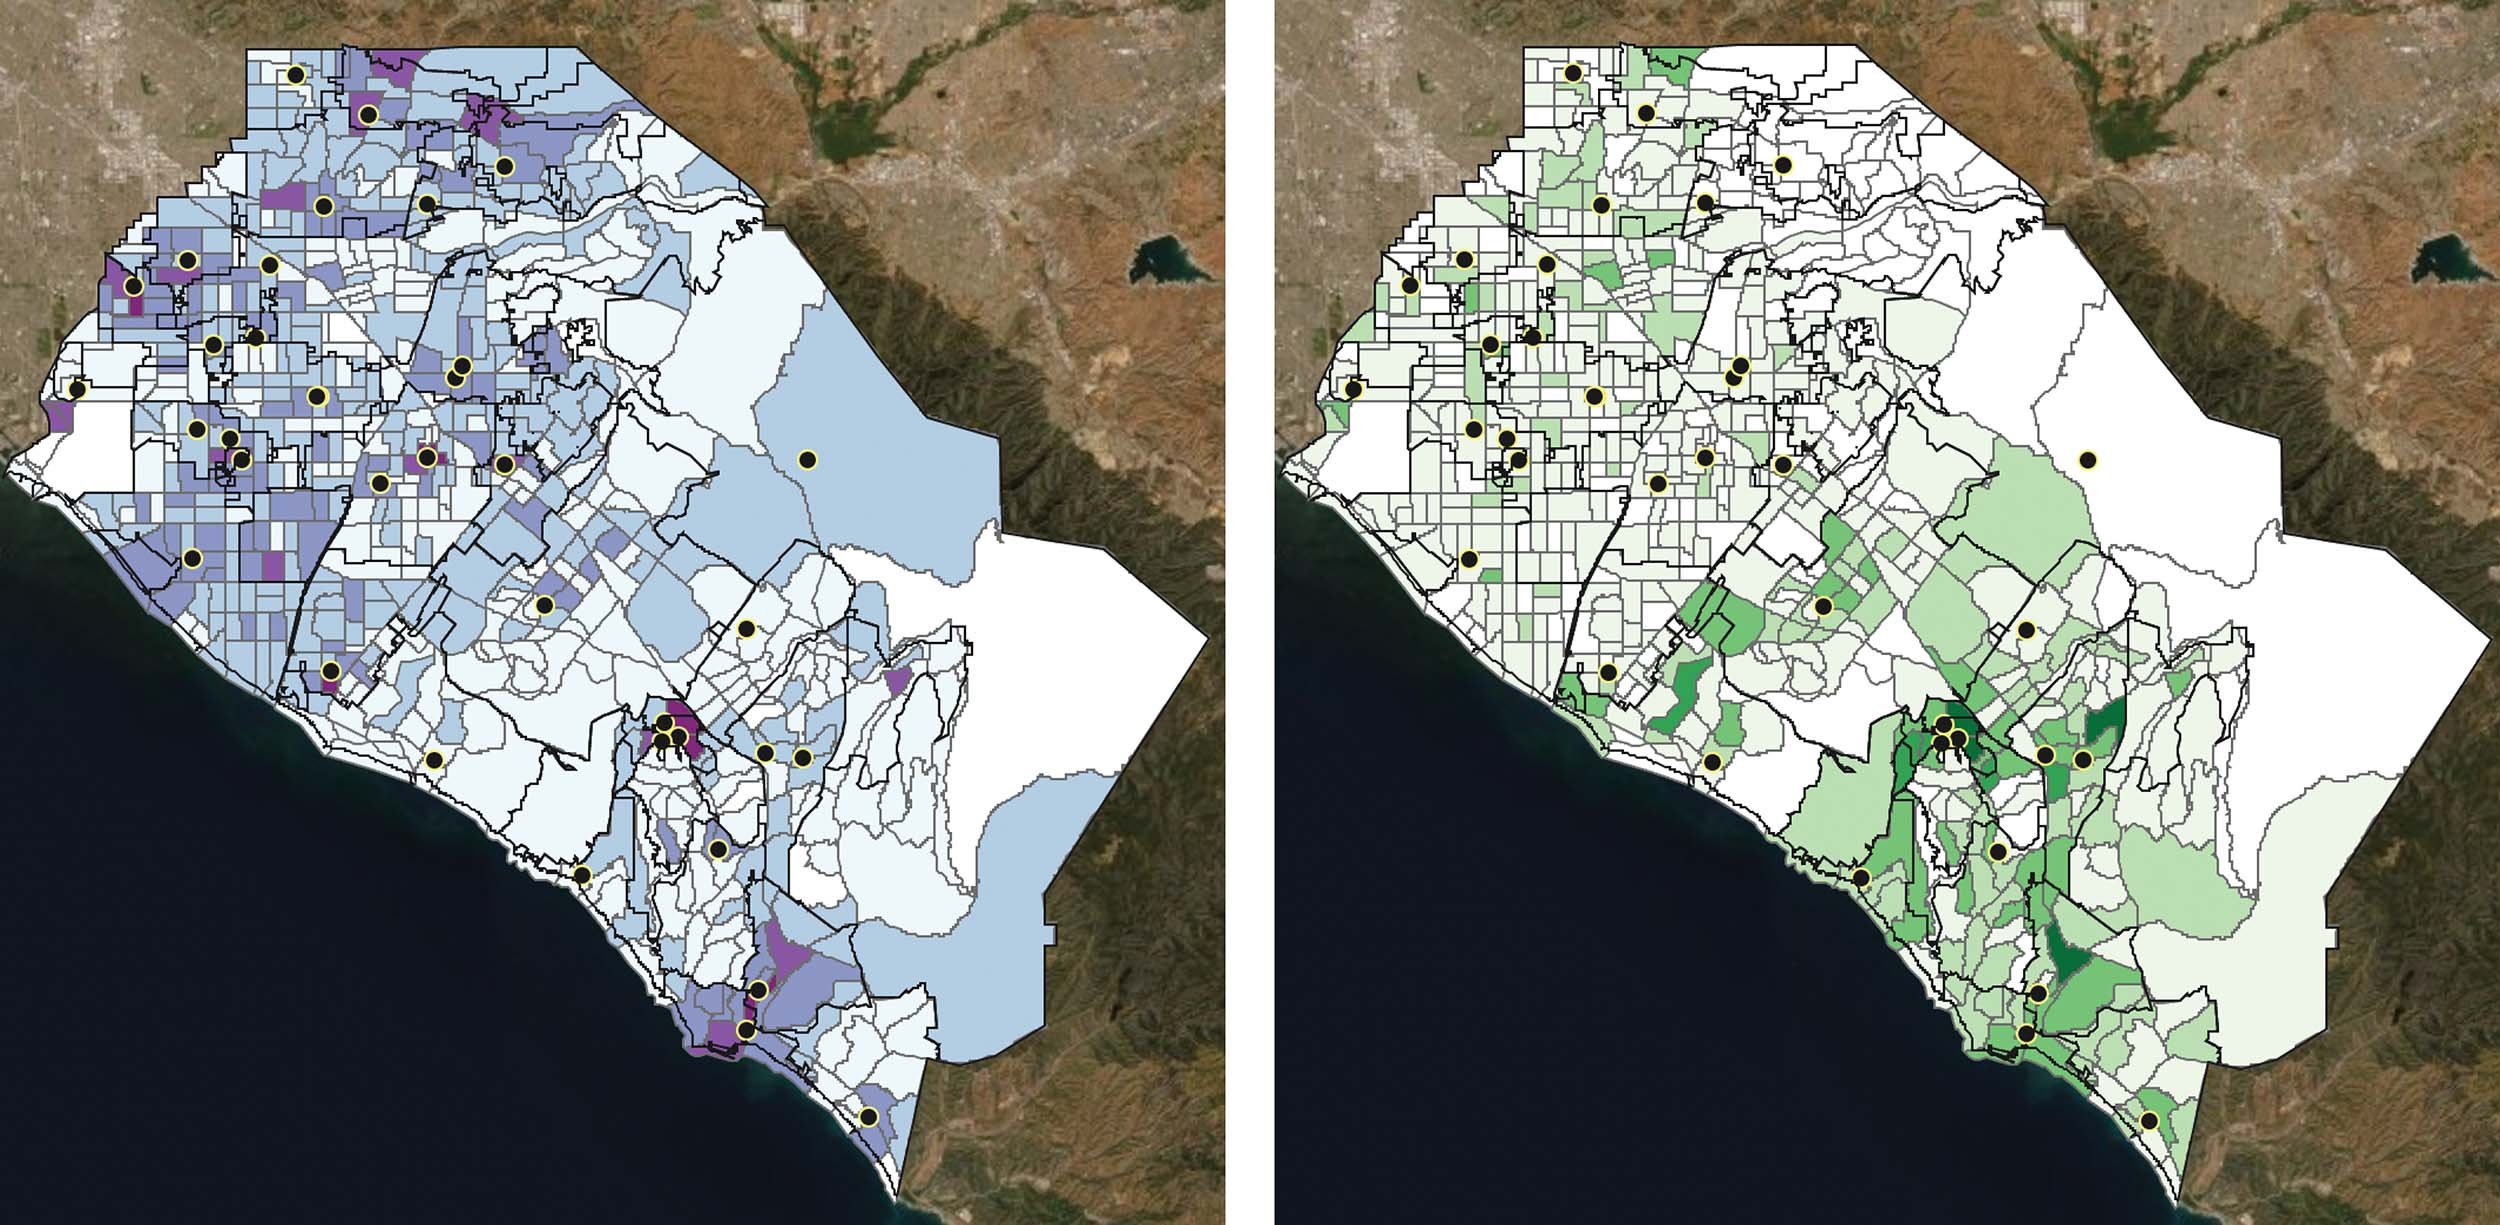
The darker shades of purple indicate more clients. The dots are the locations of the senior centers with congregate meal service. Visually you can see how the areas with the highest number of older adults who participate in congregate meals are the census block groups in close proximity to senior centers. (left)
Older adults who received home-delivered meals through the same providers are displayed in the image above. Senior centers are represented by dots. The darker colors indicate more participants in that particular census block group. Unlike the congregate meals, home delivered meal clients are more evenly distributed throughout the county. (right)
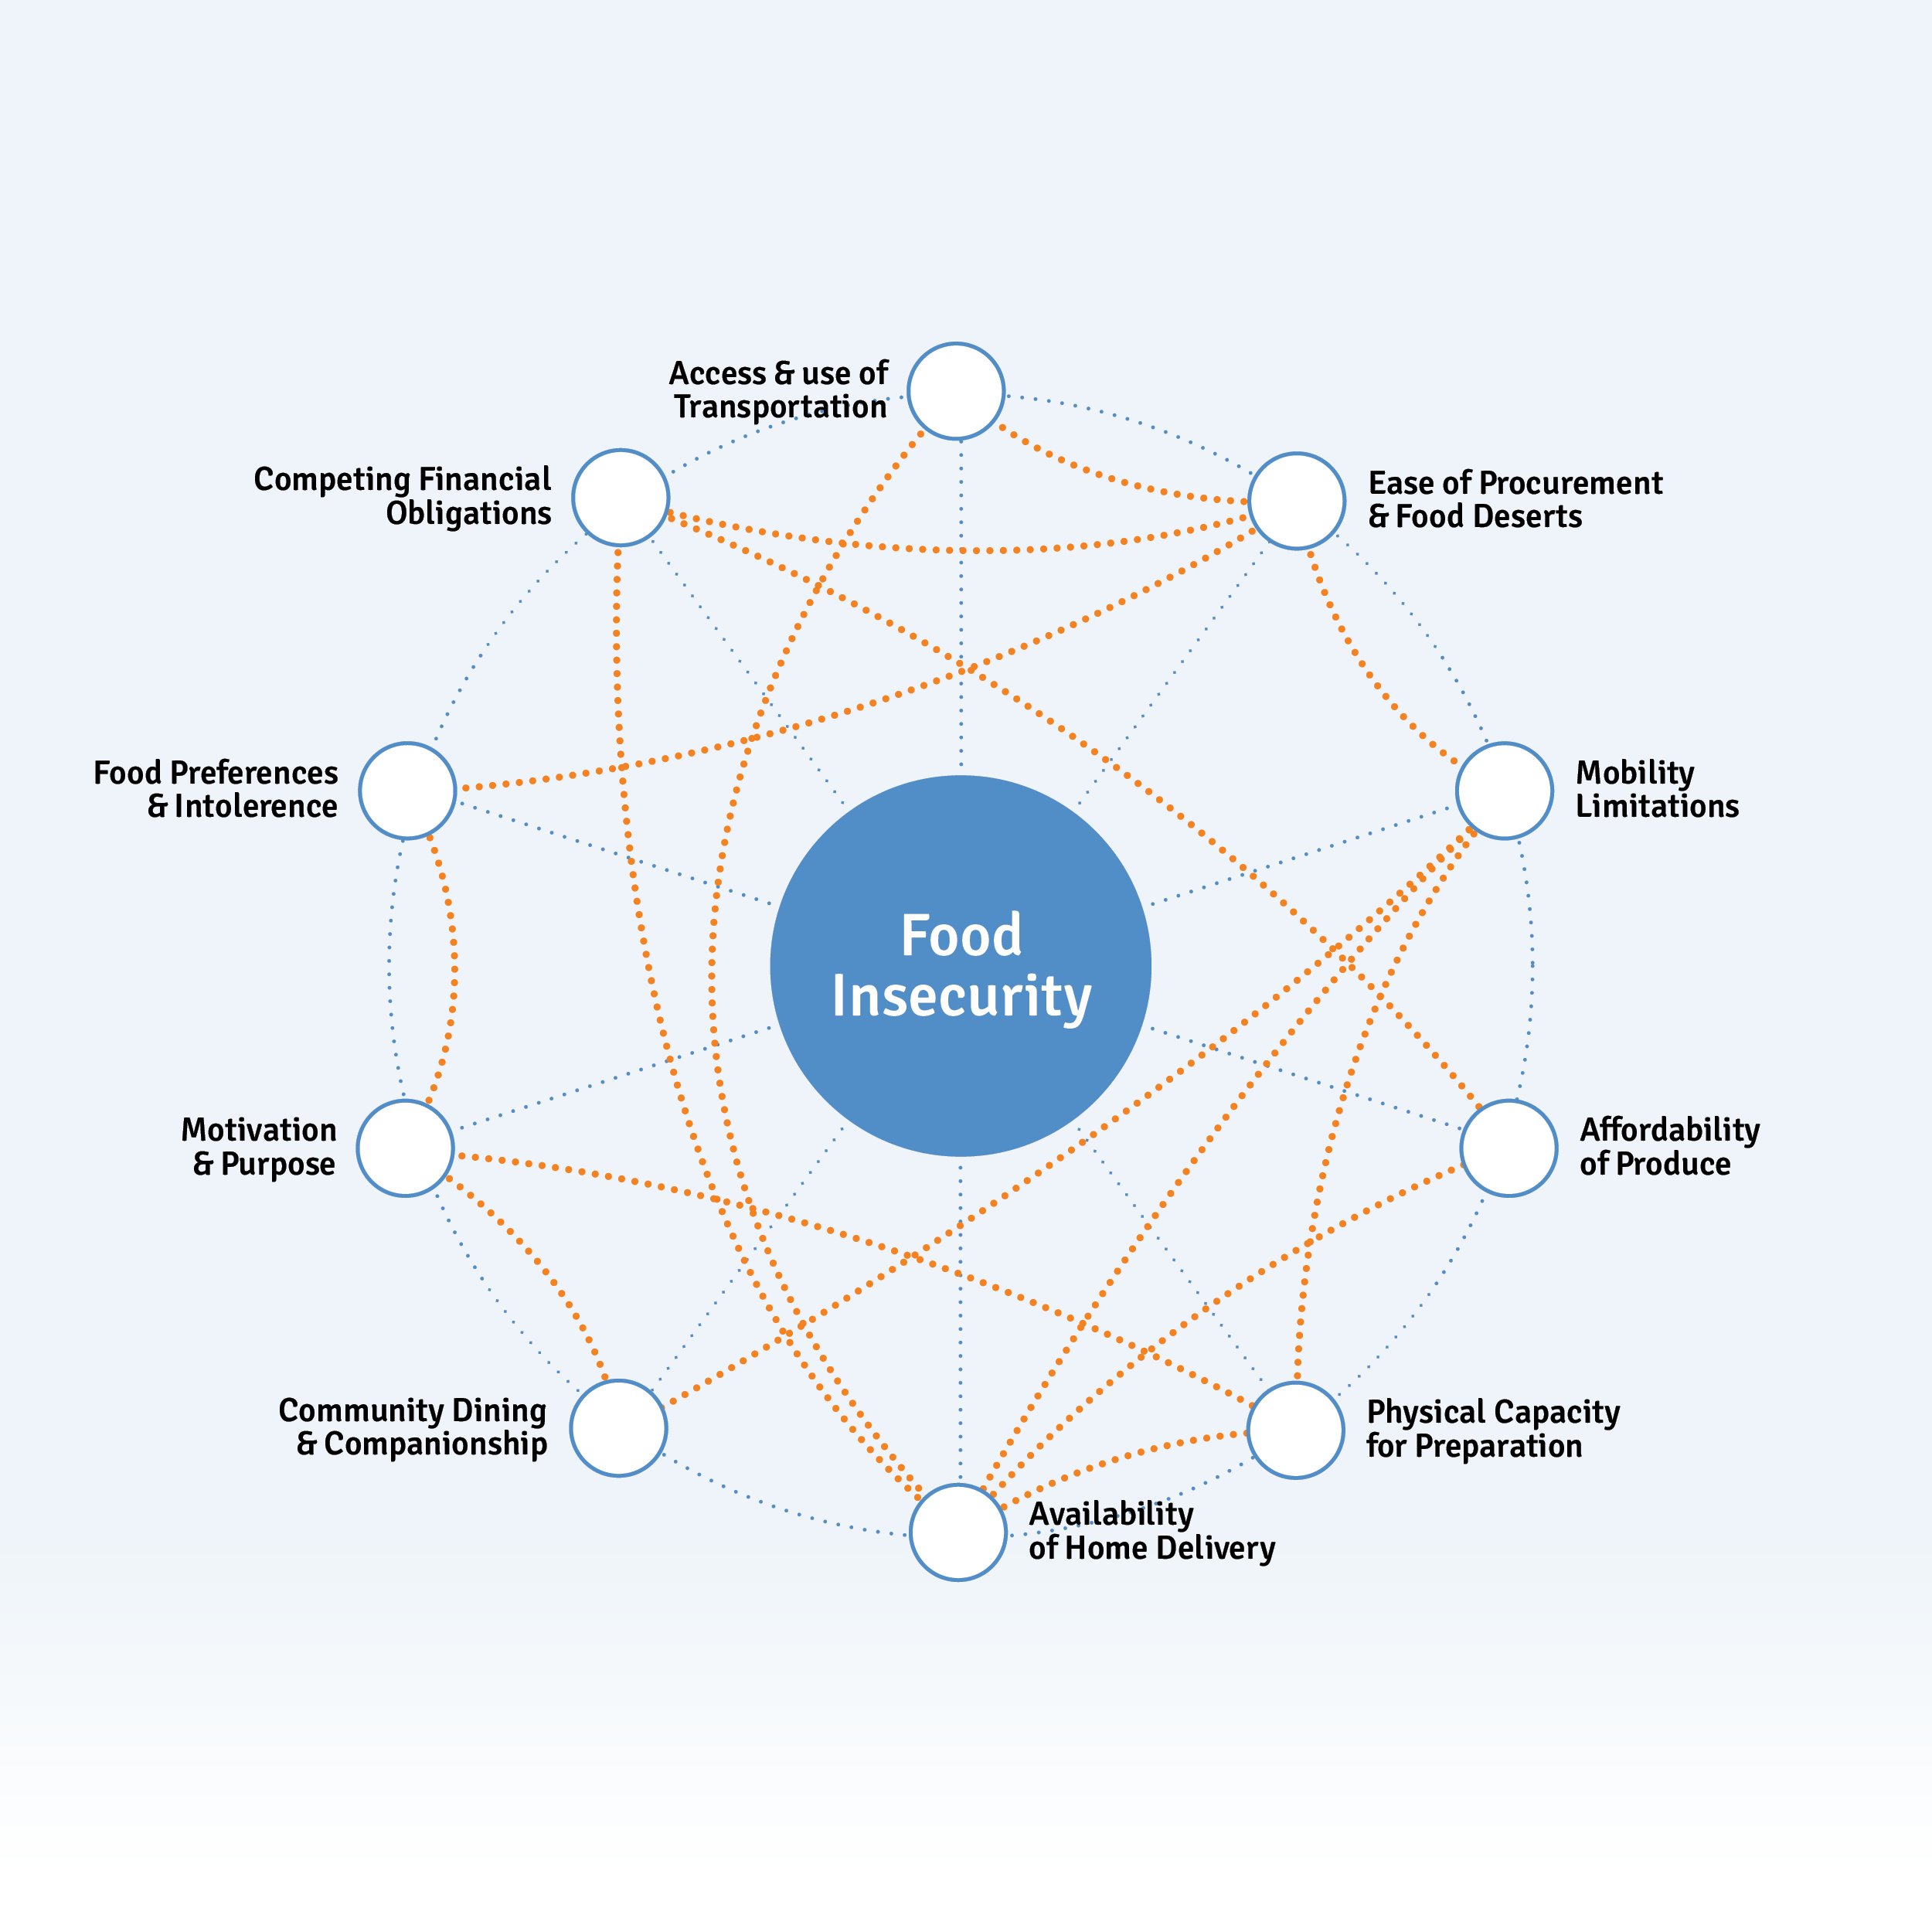
Interconnected Issues for Food Insecurity
While food insecurity is highly correlated with race and poverty, for older adults there are a large number of other interconnected issues that compound their potential consumption of food, and thereby nutrition. The solutions to nutrition insecurity can be as complex as the society we live in, or as simple as being able to open a jar or a packet. Many interrelated factors are noted here and can be grouped into several subcategories which are expanded upon below:
- Personal Values
- Physical Autonomy
- Disability & Frailty
- Medical Implications
- Affordability
- Community & Services

Personal Values
Eating is in itself a deeply personal activity. One which is influenced by routine, taste and personal preferences. Dietary restrictions for beliefs and allergies can influence nutritional intake, as can disruptions to routine such as retirement, holidays or illness.
Needing help as an adult can itself be a barrier to nutrition, since asking for help is not easy for everyone. Reasons for refusing help can be as simple as wanting to maintain control in your life, or as complicated as the real fear that you might be institutionalized for not being able to cope on your own.
There are also complicated social responses to poverty and need, and the negative stereotypes attached to it (such as being lazy or cheating) that mean asking for help might be a matter of pride.
“Some people abuse the free food system. They hoard it. For others, they have pride that stops them from getting it.”
For instance, census tracts with a higher percentage of older adults 65+ tend to show a lower than average percentage of households that participated in CalFresh (SNAP), suggesting that while it seems intuitive that those with food insecurity are more likely to participate in government-funded or subsidized resources - the program is not reaching all eligible seniors.
Equally, however, when some find out about the value and quality of services available to them, they are extremely impressed.
“$109 per week, ooh that’s a lot!” Regarding the CalFresh Restaurant Meals Program


“The need for food is more about nutrition than food. Are people getting the right food? We get good food here, but that’s only us. Others get food but is it nutritious? What about getting some meat?”
Physical Autonomy
There is a wide range of personal needs that relate to physical capacity and food insecurity, correlated with frailty, and thereby overlapping with issues of autonomy and the services needed to close the gap.
“How do you cook when you are losing your eyesight? When you forget how to cook?”
This is a sliding scale of dependency to providing and receiving the right level of nutrition. For older adults with mobility issues, reliable, timely transport and distance to fresh food influence nutrition intake the most.
Distance to fresh food has been shown by the Blue Zones project to be a key indicator of longevity. From this perspective, Orange County has excellent access to grocery stores for those aged 65+ , and only 0.9% have low access to a grocery store. Census tracts with a higher percentage of older adults tend to have an above-average percentage of the population with access to a grocery store.
While walking to the shops or marketplace to access food is beneficial for getting exercise for those who are able, in suburban communities like Orange County, reliable, timely transportation - including friends, family, and public or private services - is critical. “Food deserts” occur where there is both a lack of nearby stores and a lack of transportation or personal mobility to procure healthy food.
To make food more accessible to older Orange County residents, there are several mobile grocery projects. Second Harvest Food Bank operates the Senior Grocery and Park-It Market. The Senior Grocery program is held at 41 sites throughout Orange County and distributes food to approximately 11,146 seniors per month. The Park-It Market is a mobile food pantry that visits 11 sites and serves approximately 2,506 seniors per month. And staff and volunteers from the OC Food Bank, run by the Community Action Partnership of Orange County (CAPOC), distribute over 23,000 food boxes each month at 70 distribution sites in Orange, Los Angeles and Riverside Counties.
When the pandemic-related restrictions impacted the ability of these nutrition programs, Meals on Wheels programs implemented ‘porch visits’ rather than entering participant homes for their home-delivered meals. They also rapidly adapted their group dining in congregate settings to Grab & Go meals that participants could pick up at senior centers or receive delivered to their door.
Disability and Frailty
As frailty increases, the ability to eat independently and prepare food becomes most prominent. This is impacted by problems with packaging that isn’t age friendly and is a barrier for those with arthritis, tremors and problems with grip strength. At the highest level of frailty there is difficulty getting the food to the mouth, chewing and swallowing.
“There’s a lot of food available, but you have to cut it up, cook it. A lot of people rely on others to help prepare the food.”
18% of adults in Orange County aged 65 to 74 have a disability (51,818 individuals) whereas it affects 45.9% of adults aged over 75 (98,472 seniors), for an average of 30% of OC adults aged 65+ with a disability, which for many may be characterized as a restriction on Activities of Daily Living (ADL). It’s estimated that between 126,816 and 150,000 older adults in Orange County are living with disability.
Having a household member with a disability can increase food insecurity. About 206,846 or 19.8% of all households in Orange County have a member with a disability. About 19,213 or 37.6% of households who receive CalFresh (known federally as the Supplemental Nutrition Assistance Program or SNAP, which provides monthly food benefits to individuals and families with low-income) have a member with a disability. There is a 17.8% increase in CalFresh participation among households with at least one disabled person.
Medical Implications
Treatment for a number of chronic illnesses impact an individual’s appetite: Alzheimer’s disease; Parkinson’s disease; thyroid disorders; cancer; depression and salivary gland problems can all make eating difficult or unpleasant.
A number of medicines prescribed for common ailments associated with aging interfere with appetite. These are known as anorexigenic drugs. While other medications interfere with absorption of nutrients such as the absorption of vitamin C, vitamin D, potassium and iron.
The incidence of malnutrition ranges from 12% to 50% among the hospitalized elderly population and from 23% to 60% among institutionalized older adults. When not directly attributable to underlying disease, weight loss in the institutionalized elderly is most commonly due to depression, use of anorexigenic drugs, and dependency on staff for feeding.
Affordability
Poverty is already shown to be a key indicator of food insecurity - the reason why is more than merely the rising cost of food and supplements. Competing financial obligations mean individuals often need to choose between food, utilities, gasoline, technology, medicine and a roof over their head.
“I want fresh! Some celery, some potato salad. If I go to assisted living, they’ll take my whole check. I won’t be able to afford fresh food to prepare.”
Those who fall behind on their mortgage are nearly 8 times more likely to develop food insecurity than those who do not. Similarly, there is an increasing likelihood of cost-related medication underuse with increasing severity of food insecurity and food insecurity is directly related to out-of-pocket medical costs.
There is also a financial trade-off to choosing less-expensive lower-quality food due to the higher cost of more nutritious meat and fresh vegetables.

“[Food] Prices are skyrocketing! We can’t afford to buy a nice little steak. It doesn’t have to be big, just one to share between us.”
Community & Services
While a viable network of family, friends and neighbors is vital to staving off food insecurity, the reality for many elders is that a long life has left them isolated from vital connections. Children move, neighbors retire to more affordable cities, friends and family die. Eventually even motivation and purpose can begin to wane. Community resources are required to help older adults continue to live at home, integrate with their neighbors and make meaningful connections to their society.
“I started volunteering. There are real health benefits to staying engaged. You’ve got to walk your mile every day!”
The system of care in Orange County is complex and interconnected, with many doors for entry. While this system draws on resources from Federal and State initiatives, it’s the County of Orange, cities, and Community Based Organizations as well as a social network of family, friends, neighbors, carers, medical professionals and volunteers who deliver the food to individuals.
“I have a friend who really helps out. I can’t afford in-home support services, so she comes to help with grocery shopping, helps me get in and out of bed [with a medical lift-type device].”
Many of the organizations are familiar landmarks in the aging network: Meals on Wheels programs, CalFresh (known federally as the Supplemental Nutrition Assistance Program or SNAP, provides monthly food benefits), church outreach, community centers, food banks and pantries - but they are not an integrated system.
“The churches and the government programs don’t coordinate. No one knows what the other is doing. I found out about the free food from my neighbor and then I told my other neighbors. Now I come to pick up food for me and for my neighbor who cares for her grandson so she can’t come.”
How much food is supplied?
Through Orange County Office on Aging senior nutrition program providers Meals on Wheels Orange County, Age Well Senior Services and the City of Irvine, 1,772,499 congregate (Grab & Go) and home-delivered meals were provided to 12,788 unduplicated older adults age 60 and older in FY 2019-20, which included increased serving levels from April - June 2020 due to Covid-19. This number jumped by more than 1.1 million meals (63% increase) to 2,890,417 meals to 238,160 older adults (representing a combination of duplicated and unduplicated participants due to pandemic-related data collection changes) during FY 20-21, the first full year of the pandemic. Importantly, serving levels for the senior nutrition providers continues at very high levels compared to pre-pandemic, and as noted earlier in this report, these numbers are unlikely to reduce quickly as long as funding is available to meet the continued need.
| Meals Served | Congregate | Home Delivered | Total Meals |
|---|---|---|---|
| FY 19-20 Meals Served | 600,309 | 1,172,190 | 1,772,499 |
| FY 20-21 Meals Served | 1,531,092 | 1,359,325 | 2,890,417 |
Source: Orange County Office on Aging
| People Served | Congregate* | Home Delivered | Total Meals |
|---|---|---|---|
| FY 19-20 Clients | 10,335 | 2,453 | 12,788 |
| FY 20-21 Clients | 234,086 | 4,080 | 238,160 |
*Includes duplicated and unduplicated due to Covid-19 data collection changes
**Unduplicated
Other meals offered for a limited time to seniors during the pandemic, such as Great Plates Delivered and special Orange County Board of Supervisor meal gap programs, are not included in these numbers. Fee-based meals from nonprofits such as Meals on Wheels of Fullerton, La Habra Meals on Wheels, and Placentia Yorba Meals on Wheels also are not included in the numbers above, although they are reflected in the Home-Delivered Meal geo map referenced previously.
In the fiscal year 2019, 52 million pounds of food were distributed to food pantries by OC Food Bank (a program of Community Action Partnership Orange County) and Second Harvest Food Bank of Orange County, for people of all ages. In 2020, this increased to 105 million pounds of food, a substantial increase that is clearly due to the COVID-19 pandemic, and held steady at 102 million in FY 2021.
| FY - 2019 | FY - 2020 | FY - 2021 | |
|---|---|---|---|
| OC Food Bank* | 23 Million | 63 Million | 43 Million |
| Second Harvest Food Bank | 29 Million | 42 Million | 59 Million |
*OCFB is on a calendar year
**SHFB is on a fiscal year
Translating pounds of food into meals is not as straightforward as it might seem. A pound of pasta or processed food will have a significantly different nutrient profile than a pound of fresh vegetables. Accordingly, different agencies use different conversion metrics. For example, Feeding America uses 1.2 pounds of food per meal whereas the USDA uses 1.7 pounds. If we use the more conservative conversion rate from the USDA of 1.7 lbs per meal, this is the equivalent of at least 30.6 million meals in 2019 and 61.8 million meals in 2020 from the combined Orange County food banks. Divided by five meals a week, 52 weeks a year, that potentially equals 117,692 people fed in 2019, and 237,692 people fed in 2020. Not all of these meals are distributed to older adults, but using the CalFresh figure of 29.4% for food insecurity in low-income older adults, it means that potentially 70,000 adults aged 65+ received some food assistance from food banks.
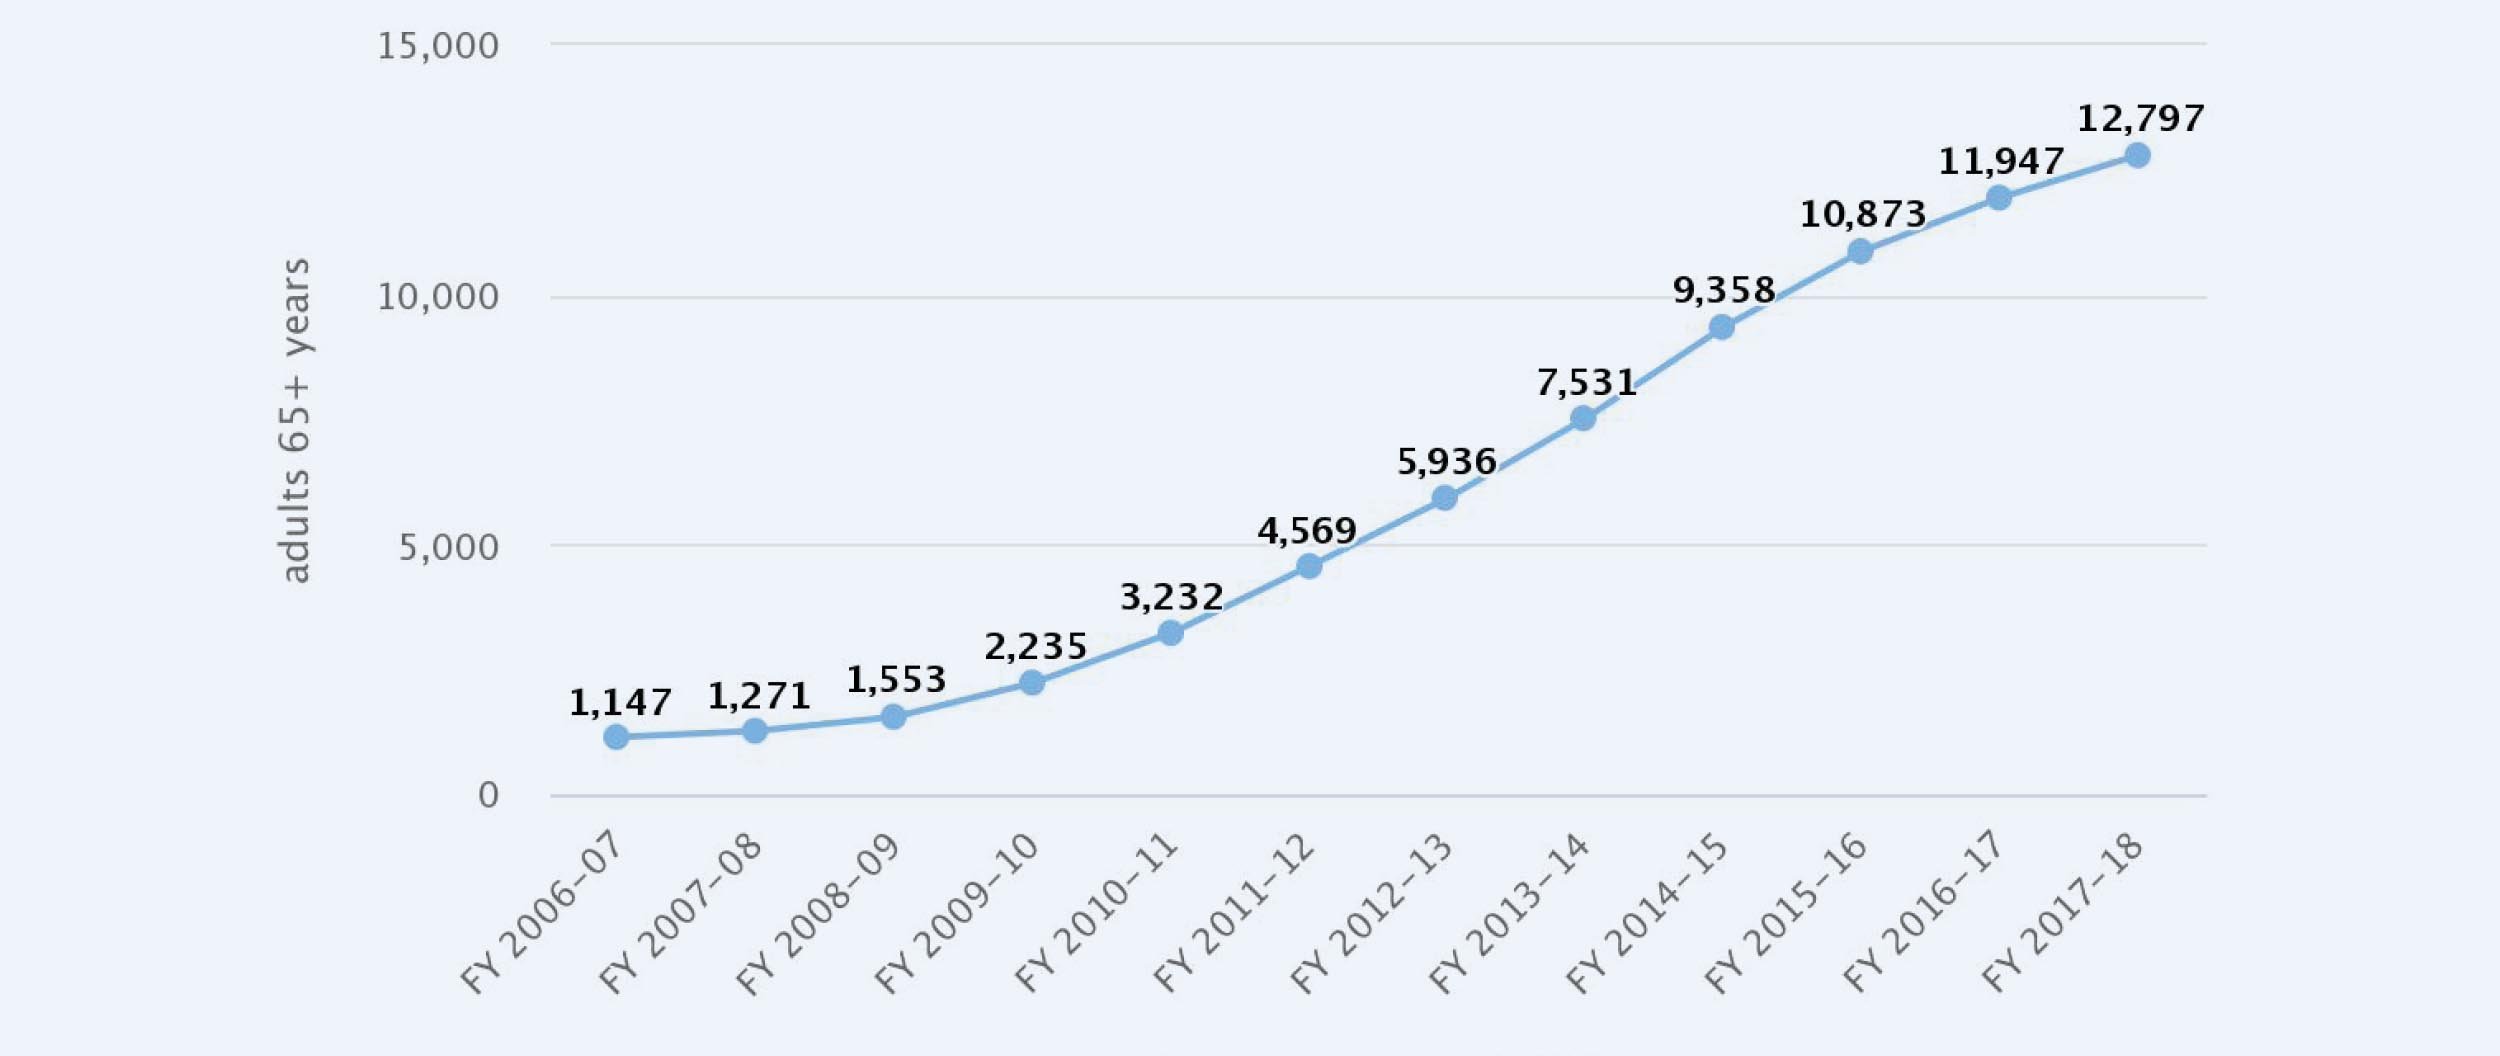
CalFresh (SNAP) provides direct food support primarily through Electronic Benefits Transfer (EBT) cards. It’s important to note that California has one of the lowest participation uptake rates in the country. According to the Orange County Social Services Agency reasons for low older adult participation include stigma, program myths or lack of program information, application barriers (e.g., technology, mobility & transportation, limited English proficiency) and the burdensome application process. Even with this underutilization, average CalFresh participation of adults 65+ between 2006-2017 (as noted in the OC Healthier Together dashboard) showed an increasing trend over time, starting with around 1,147 enrollees in FY 2006-07 and growing to 12,797 enrollees in FY 2017-18.
Adults 65+ Enrolled in CalFresh Program in Orange County

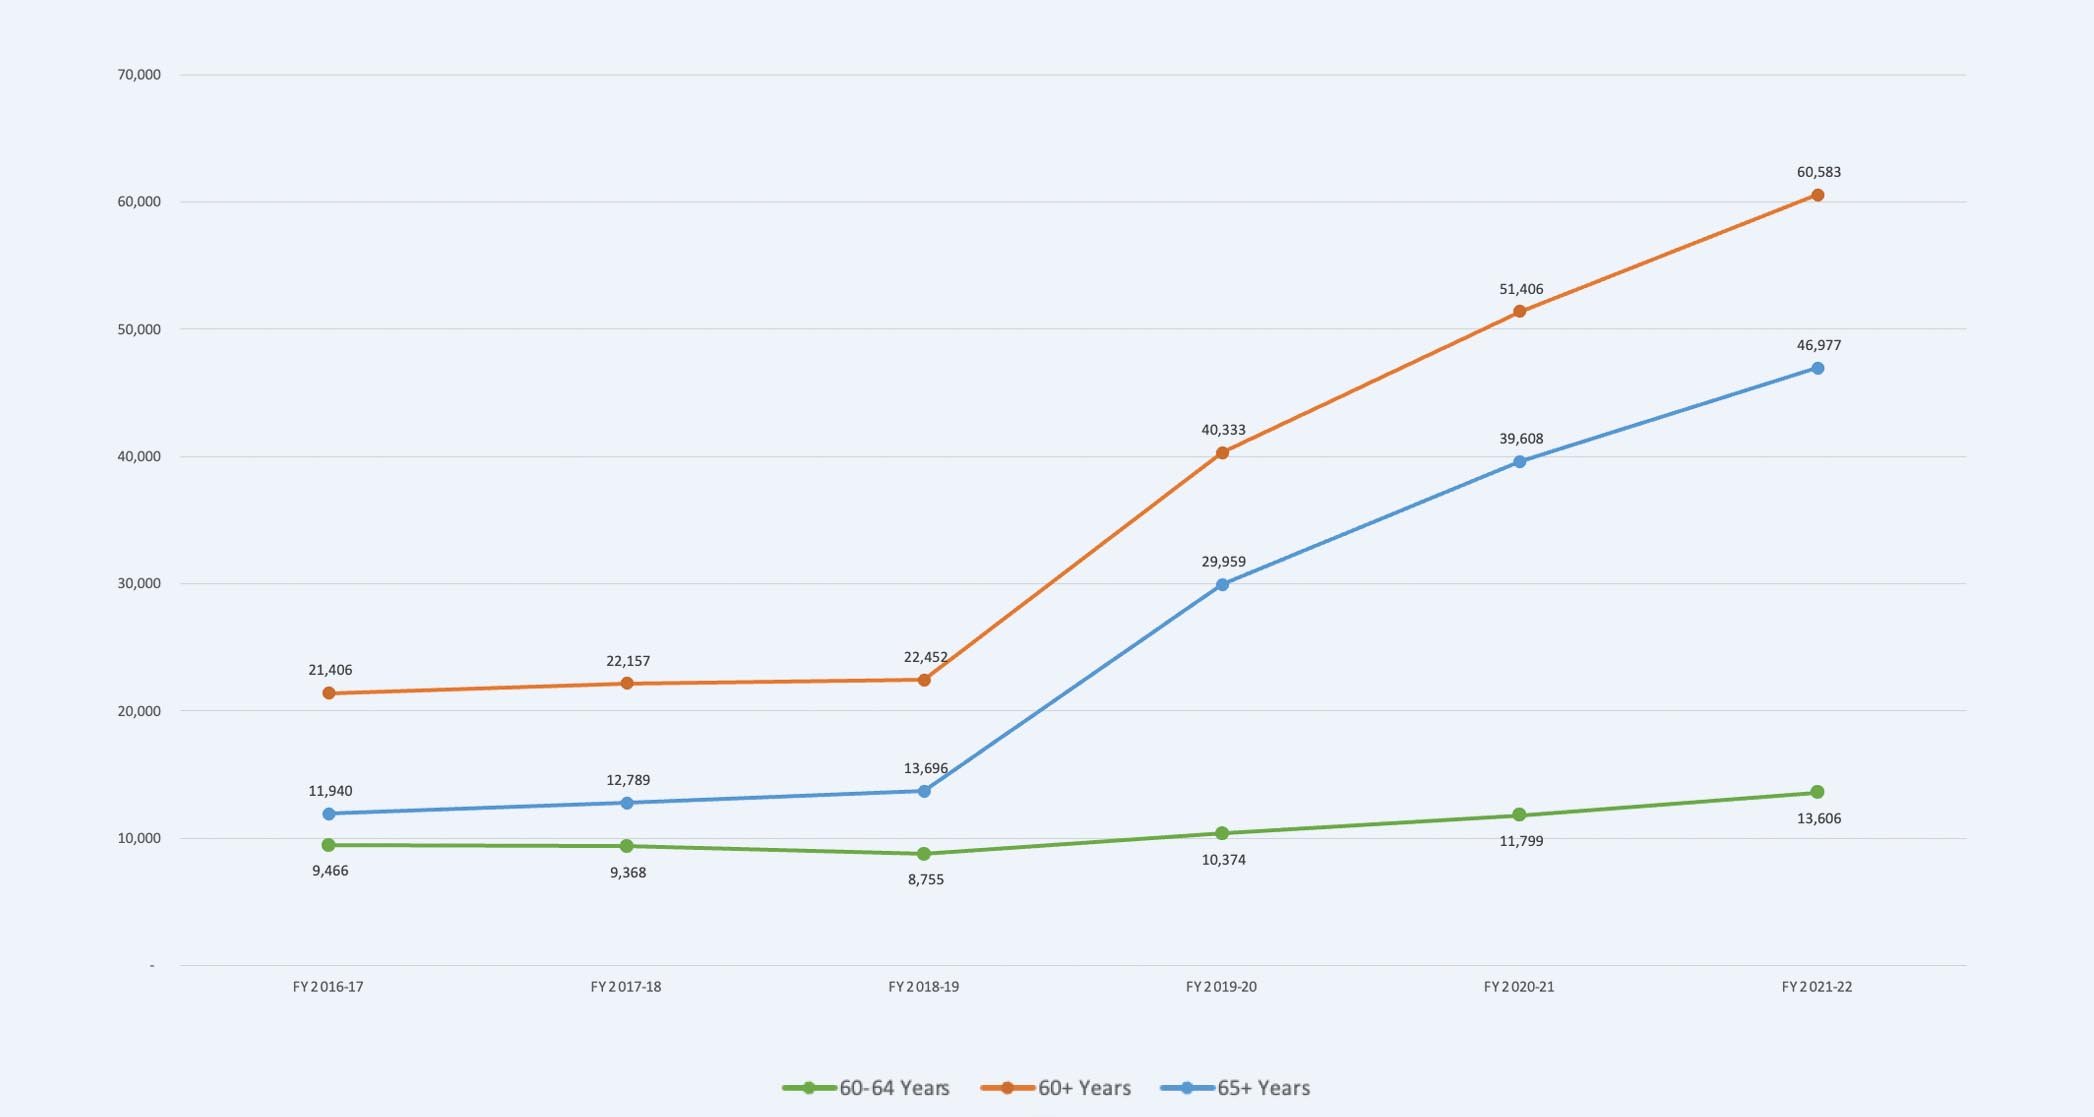
What is even more striking is the increase in average CalFresh participation between FY 2017-18 and FY 2021-22. During this time period, an additional 34,184 adults aged 65+ enrolled in CalFresh, which represents a 267% increase over 2017-18 enrollment. Thus, in the past 15 years CalFresh participation for adults 65+ in Orange County has grown from an average of 1,147adults 65+ in FY 2006-07 to 46,981 adults 65+ in FY 2021-22, which represents nearly a 4,100% increase in participation. If we consider CalFresh participation of adults in the 60-64 age group into the totals, a staggering 60,629 older adults aged 60+ received food support directly through CalFresh in FY 2021-22. Given what we know about underutilization, there may be many more older adults who do not receive this income-based food support.
Other indicators suggest that some of these older adults may not participate in CalFresh because they live in households with others. There are approximately 1,044,280 households in OC, of which, 442,385 (42.4%) have one or more people aged 60+. Of those households with at least one member who is aged 60+, 21,803 are receiving CalFresh (SNAP) benefits (2.09% of all households in OC). Out of the 51,112 households who receive CalFresh, 42.7% of them have at least one member who is aged 60+. The data are not clear about whether the older adult or another member of the household participates in CalFresh. However, even if the older household members are not direct recipients, they may receive support indirectly.

Source: ACS 2019 table S2201
The Food and Security Initiative of the OC Strategic Plan for Aging has rallied around increasing older adult enrollment in CalFresh, and includes the following participating organizations: 211OC, Age Well Senior Services, Community Action Partnership of Orange County, City of Garden Grove, City of Irvine, City of Mission Viejo, Meals on Wheels Orange County, OC Food Access Coalition, OC Food Bank, OC Health Care Agency, OC Office on Aging and Second Harvest Food Bank.
Importantly, the challenge with presenting estimates of the numbers of people who received food from different sources is that there is no way to know if some people received support from more than one source, such as senior groceries from a food bank and congregate meals from a senior nutrition provider, or if there was little overlap. Given the various programs have different funding sources and reporting requirements, including participant confidentiality, there is no definitive way to estimate the overlap. Further, just because someone receives a food box once a month or a congregate meal doesn’t mean that all of their food needs are met. Home-delivered meal programs offered by nonprofits such as Meals on Wheels Orange County and Age Well Senior Services in partnership with the Orange County Office on Aging provide the most comprehensive nutrition solutions for homebound older adults, because the programs provide nutritionally-balanced breakfast, lunch and dinner for five days a week delivered to the home, and may offer additional meals for those with greater needs.
California’s Master Plan for Aging Initiatives Relating to Food Insecurity
Reference numbers relate to California’s Master Plan for Aging’s Five Bold Goals for 2030 to be used with their progress dashboard and budget.
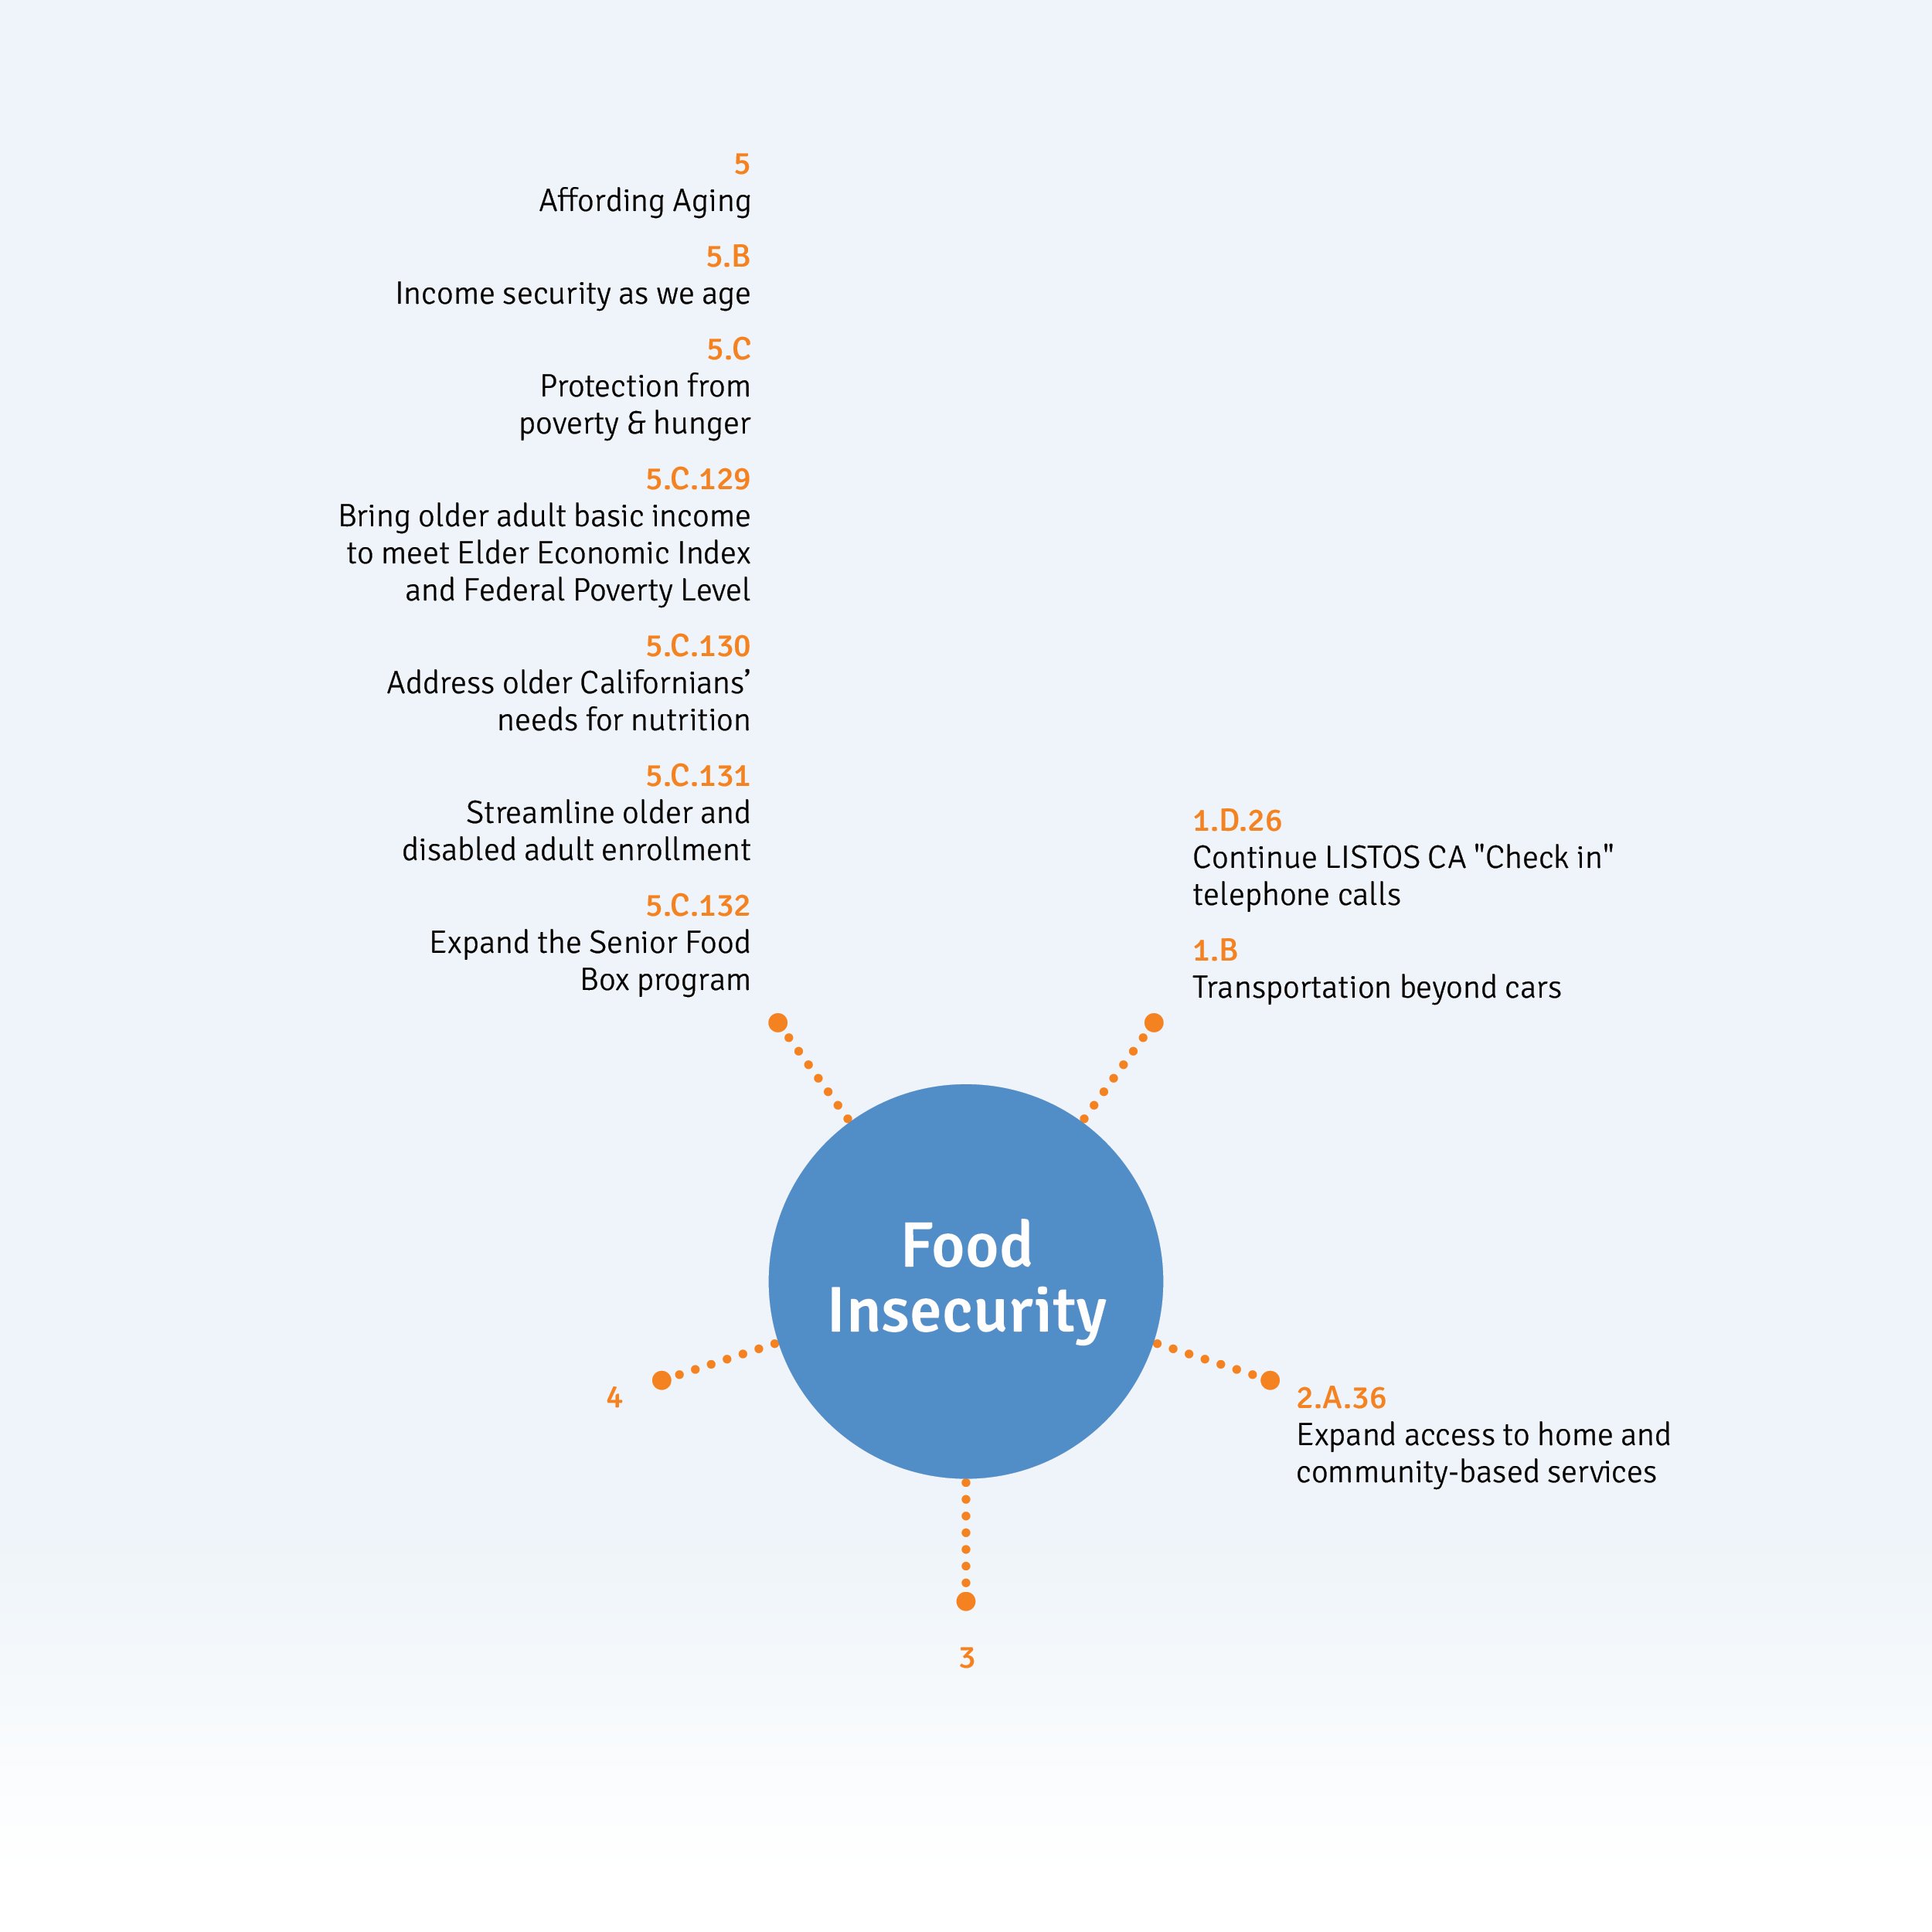
Within the California Master Plan for Aging, its relatively few goals and initiatives aimed at counteracting food insecurity are quite broad but large in scale. Strategy 5C highlights that hunger is directly related to poverty, and that the wide range of programs to distribute to the diverse locations of need – markets, food banks, day centers, home, and food boxes – needs ongoing support. In parallel, community transportation that assists older adults getting access to food, is being supported.
From a logistics and supply volume perspective, the MPA notes that, “the hunger and nutritional needs of older Californians need greater assessment and coordination” which implies that the activities among the involved stakeholder organizations require better information-sharing to know what each other is doing. And getting deeply pragmatic, Initiative 5.C.130 intends to find out who actually needs nutritional help. This is a basic issue of impact metrics, where there is a very large supply but a substantially undifferentiated demand, and an even more existential question about who the consumer actually is.
To offset this problem, mostly defined as one of poverty and therefore personal financial resilience, the question of eligibility for support services, and the streamlining of access to support, receives attention. Strategy 5B, which looks at income security as we age, aims to strengthen the “three sources – individual savings, employer-based retirement, and Social Security”. The cost of living and cost reduction is of course an ingredient in this, across housing and health costs, and is targeted for data collection and benchmarking along with CalFresh participation.
Diversity, equity and inclusion also finds representation via an acceptance that food choices are both cultural and influenced by medication, leading to “medically tailored meals”.