According to the Americans with Disabilities Act a disability is a physical or mental impairment that substantially limits one or more major life activities.
There are many conditions of aging that cause profound disability: blindness from glaucoma, macular degeneration, cataracts, diabetic retinopathy; age-related hearing loss (presbycusis); chronic diseases such as ALS, Parkinson’s or Alzheimer’s.
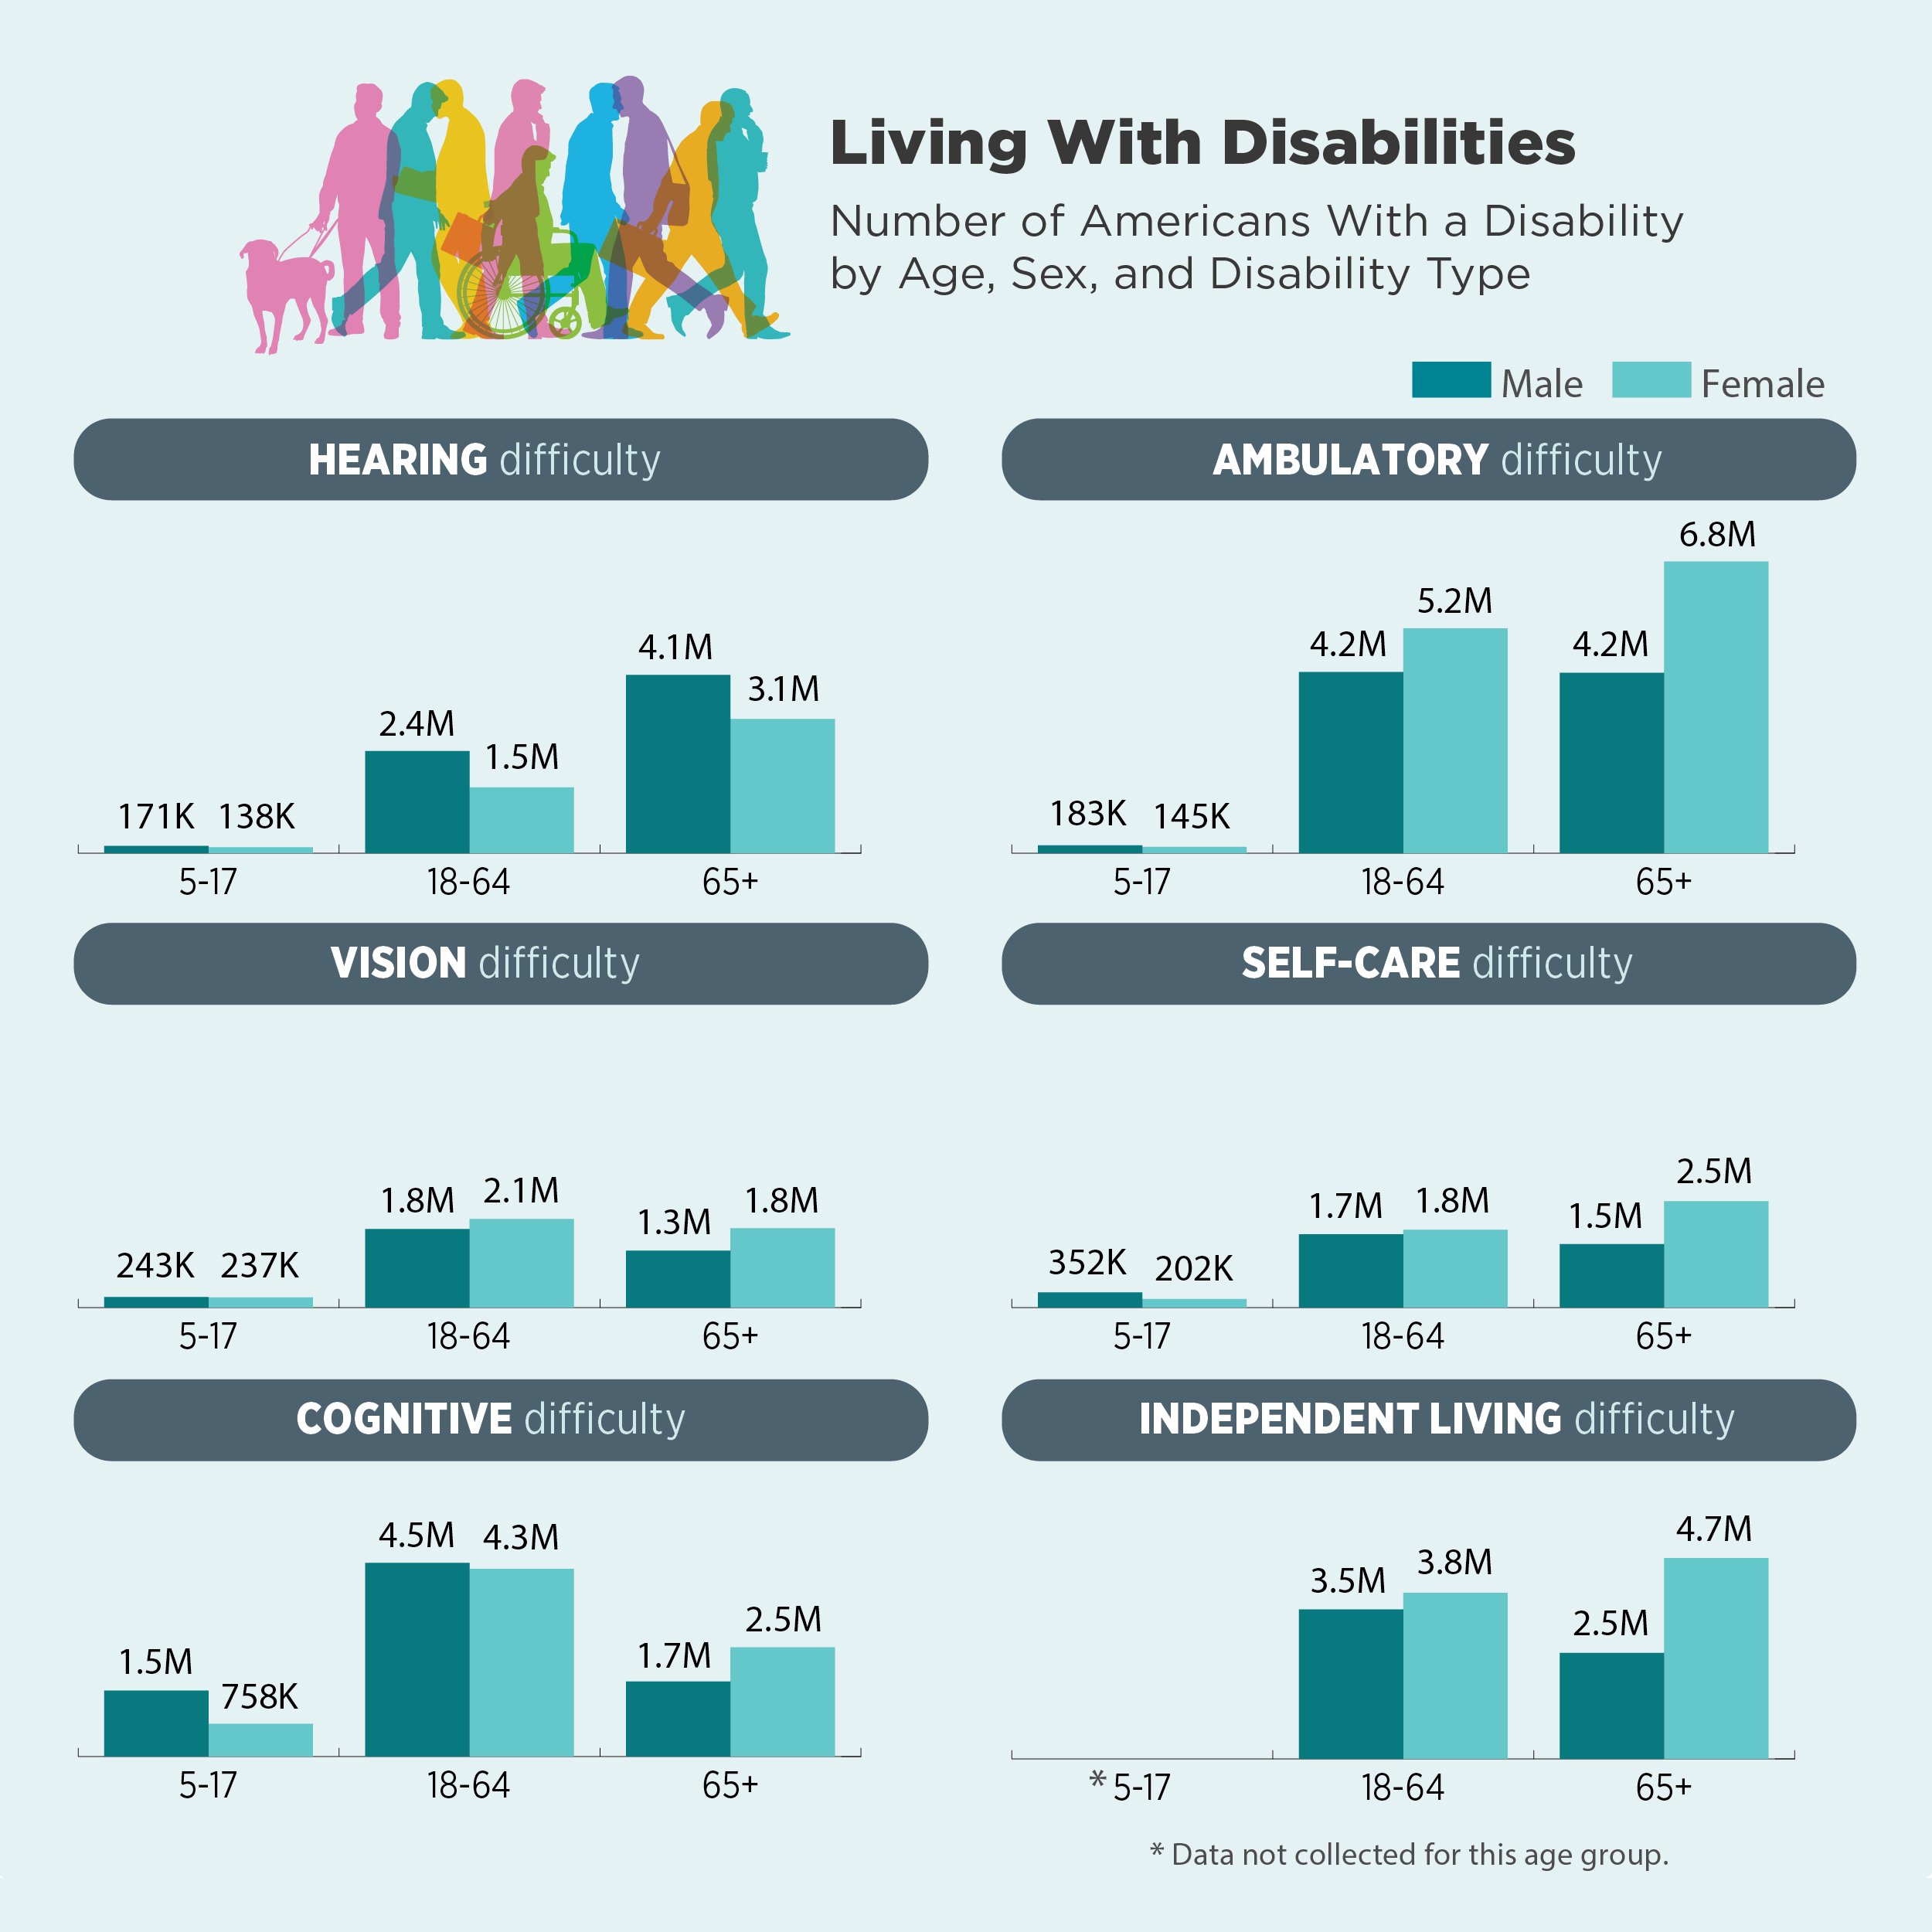
Data Overview
The rate of disability from ages 65-74 is about 18%; that more than doubles after 75 years to 45.9% and affects millions of Americans each year.
There are also difficulties related to older parents who are the carers of adult children with disabilities - particularly Down Syndrome, Amyotrophic lateral Sclerosis (ALS), mental health issues, and mobility impairment due to accident or injury.
Disabilities can be categorized into four main types:
- Lifelong / congenital
- Acquired possibly by trauma: car accidents, sports injuries, veterans
- Age related: arthritis, instability, eyesight, hearing, chronic diseases: Cancer, Diabetes, Parkinsons, Alzheimers
- Older parents who are carers of adult children with disabilities.
“Age over 65” in the third, you can see the Digital Divide by age:

Source: 2018 American Community Survey
Measurement
The bulk of measurements for disability in the U.S. come from the American Community Survey (ACS: the Census.) The ACS does not include questions relating to mental health impairment, the source for which is from the Center for Disease Control and Prevention where chronic mental health (schizophrenia, bi-polar, psychosis etc) is measured but not revealed, as estimates don’t meet National Center for Health Statistics standards of reliability. This seems to be a gap in the national data.
Adults with disabilities report experiencing mental distress almost 5 times as often as adults without disabilities.
To find the number people in Orange County with a disability requires three different metrics:
- The ACS population of the county 2020 = 3,186,989
- The ACS population of the county aged 65+ = 15.3% = 487,609
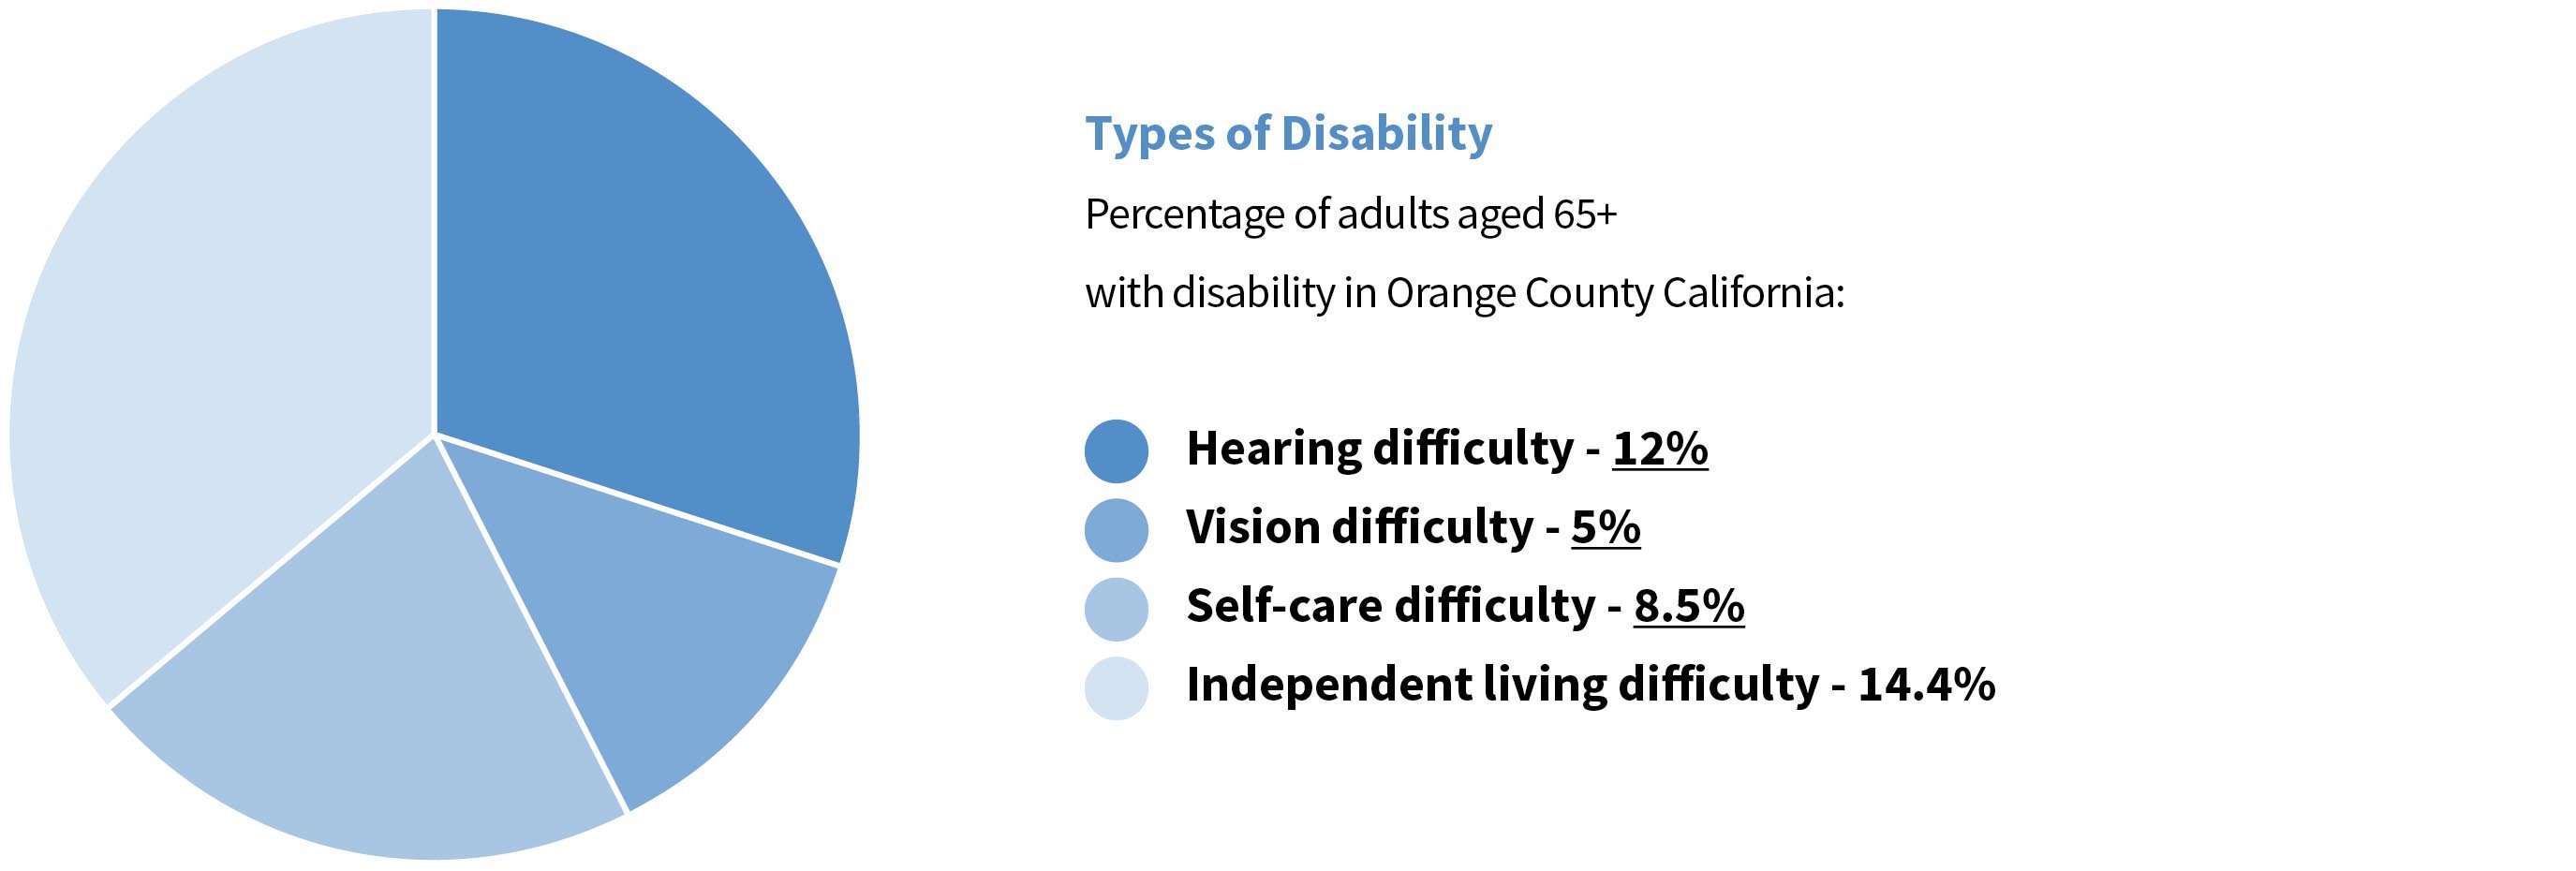
- The percentage of the population aged 65 + with disability in Orange County (OCHealthier Together) 30.4% = 148,233 people
- 148,233 individuals = 4.65% of the total Population of Orange County
- The ACS percentage of the population with a disability up to the age of 65 = 5% = 159,350 people.
Total disabled population of Orange County:
- 148,233 people = 4.65% of Orange County are older adults with a disability aged 65+
- 159 350 people = 5% of Orange County are people with a disability aged less than 65 years
- Total disability in Orange County = 307,583 people = 9.65% of total population
(Margin of Error: Disability Compendium figure = 8.5% of the county are disabled = 270,894 Error: 36,689 people = 1.15%).
The data at OCHealthier Together also reveals there has been a gradual >1.2% overall decline in the 65+ disability by population % in the 10 years since 2008. This decline from 31.6% in 2009 to 30.4% in 2019 coincides with the introduction of the Affordable Care Act on March 23rd, 2010.

Cost of Disability
In 2015, disability-associated health care expenditures were $868 billion nationally. The range per state was from $1.4 billion in Wyoming to $102.8 billion in California. Disability accounted for 36% of total healthcare expenditures and ranged from 29%-41% of state expenditure. The DAHE cost per person with a disability in California in 2021 was $19,949. If the figure is similar for the county, the cost of care for Orange County’s ~307,583 disabled individuals is in the order of $6.1 billion each year.
In 2018, Researchers at Stony Brook University estimated that a household containing an adult with a disability that limits their ability to work requires, on average, 28% more income to obtain the same standard of living as a similar household without a member with a disability.


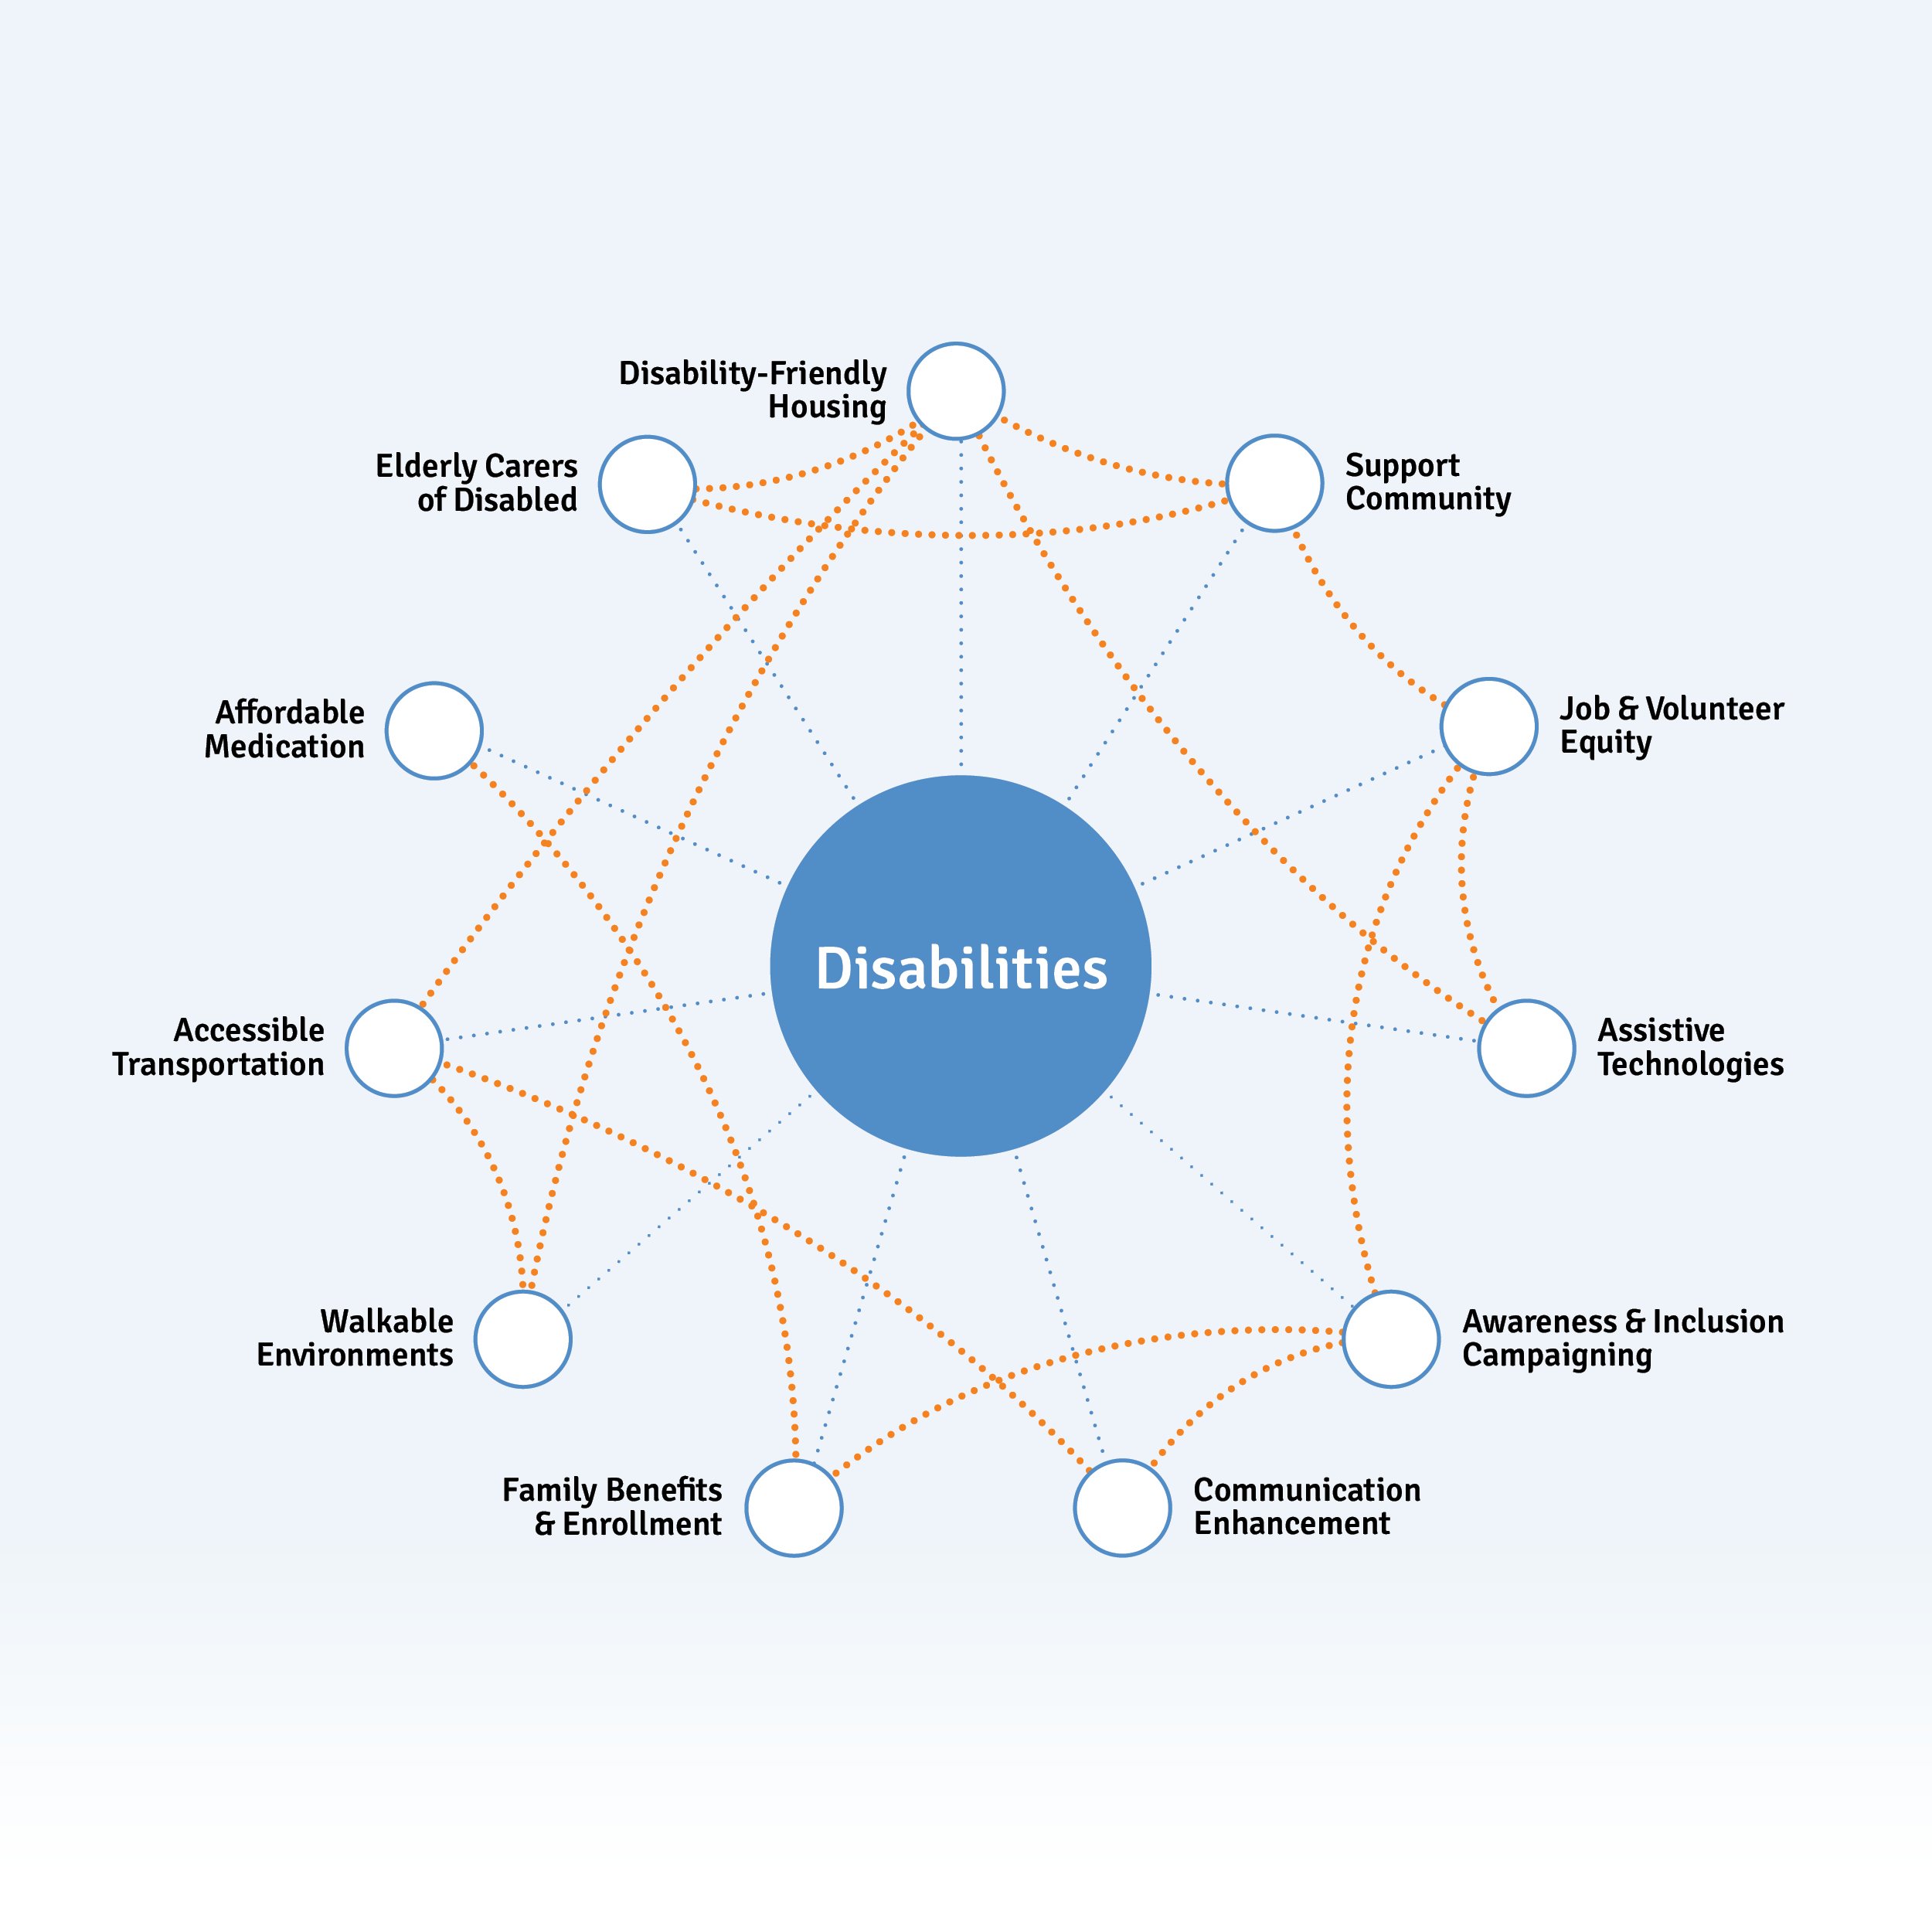
Interconnected Issues For Disability
There is a strong relationship between disability and health. The extent to which a person is limited by a disability is heavily dependent on the social and economic environment in which they live. As individuals age, there are numerous physical, financial and medical impacts which can lead to the introduction (or increase) of disability. Many of these interrelated factors are noted here, and can be grouped into several subcategories:
- Job & Volunteer Equity
- Care Partners 60+
- Disability by Cities in Orange County
Job & Volunteer Equity
As there is a correlation between poverty and health, there is evidence that poverty also impacts disability by reducing access to regular medical care, quality education, remedial and preventive measures, home modification and lifestyle support.
Because of the additional living costs associated with disability, working-age adults with disabilities are twice as likely to have incomes under the poverty threshold; they’re more likely to be unemployed; and those who are employed have lower wages.


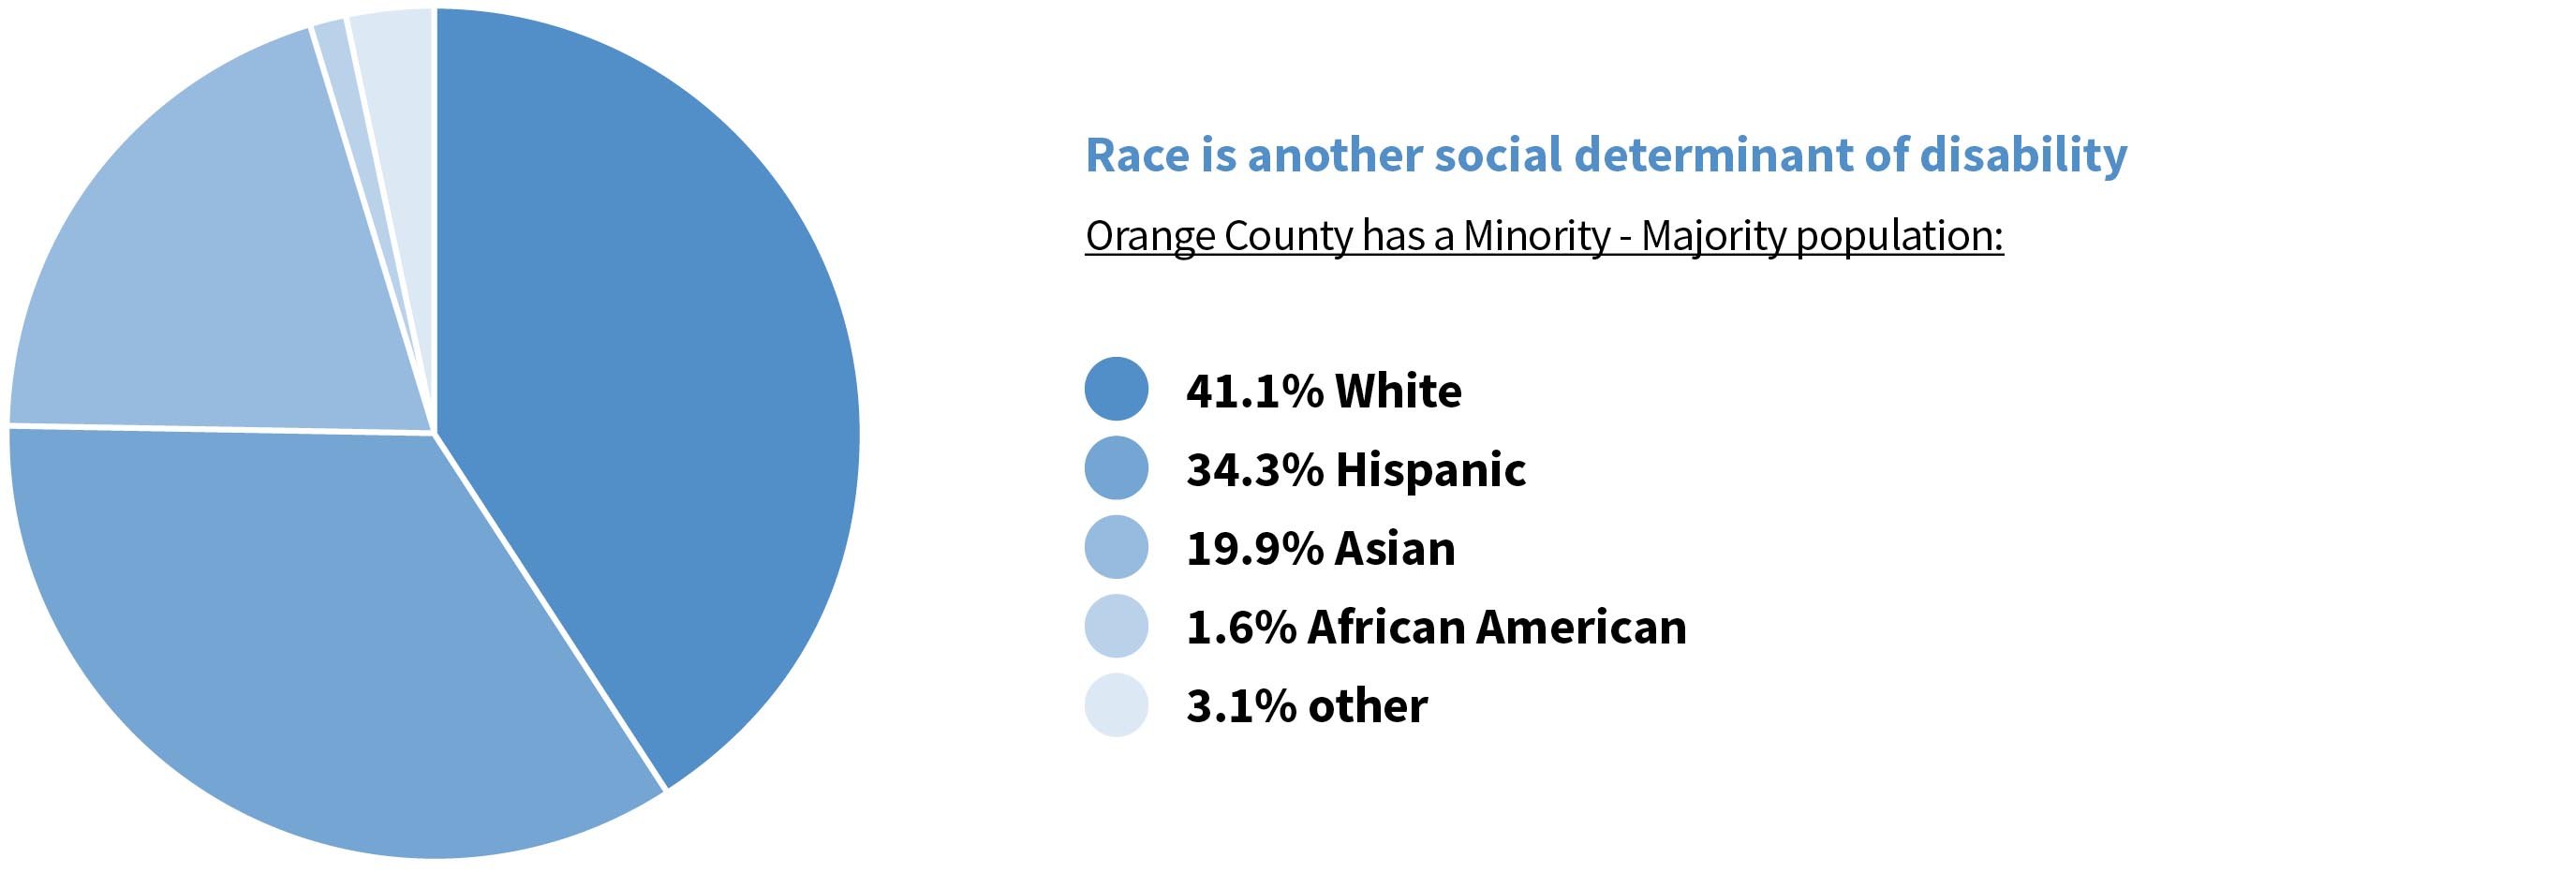
Source: Orange County has a Minority - Majority population:
Yet, according to the Disability and Health Data System (DHDS) the difference between populations regarding disability by race is marked: (Some people identify as more than one race, so the amount does not equal 100%.)
- 29.6% Hispanic
- 29.5% Multirace non-hispanic
- 23.7% Black, non-hispanic
- 21.3% American Indian, Alaska Native non-Hispanic
- 21.2% White
- 15.6% Asian, non-hispanic
According to the National Disability Institute, in America, 26% of individuals with a disability are living below the poverty line compared with 11% of individuals without a disability. “The poverty rate of BIPOC (Black, Indigenous, and people of color) communities is higher than the rate of White communities regardless of disability status. However, regardless of race and ethnicity, individuals with disabilities are significantly more likely to be living in poverty than those without disabilities. The groups with the highest poverty rates are Black and Indigenous individuals with disabilities." Further, residents of impoverished neighborhoods or communities are at increased risk for mental illness, chronic disease, higher mortality, and lower life expectancy. “Some population groups living in poverty may have more adverse health outcomes than others." As poverty impacts some sectors of society unequally, the marked increase of disability by race may also be a result of poverty.
Also, as most medicines have traditionally been trialed on young white male college students, there may also be a medical bias by race and gender which may have some impact on disability.
Care Partners 60+
Caregiving involves providing for the physical and/or emotional needs of another individual, in this case, an older adult. Caregiving can be formal (e.g., a paid in-home service, assisted living, nursing home) or informal (i.e., care received at home from family or friends, typically uncompensated).
These problems are all exacerbated when the carer is an older adult, caring either for a spouse, disabled adult child or relative.
Juanita lives with her autistic son. She has diabetes and significant joint pain. “We take care of each other. It would be nice to have someone to help come over and see how you are doing. If you’re ok. Maybe to give you a little help.”
According to AARP and their, Understanding the Impact of Family Caregiving on Work report, 53 million Americans provide caregiving support to an older adult or child with special needs, an increase from 43.5 million in 2015. 34% of caregivers are 65+ years or older. Of these caregivers, one third report being in fair to poor health. The number of hours dedicated to caregiving increases with the age of the caregiver, with older caregivers, 65+ giving more than 30 hours a week in family caregiving.
Older family caregivers (aged 50+) who leave the workforce to care for a parent lose, on average $304,000 in wages and benefits over their lifetime. These estimates range from $283,716 for men to $324,044 for women.
Disability by Cities in Orange County
It is possible at the OCHealthier Together dashboard to view the data by cities. It’s also possible to relate this back to the original ACS surveys and arrange the data by city in Orange County. Doing this
Shows that Coto de Caza is the city with the lowest age-based (65+) disability with 15.2%. Newport Beach has the second lowest age-based (65+) disability at 21.1% of the elderly population. At the other end of the spectrum, Midway City has the highest age-based (65+) disability with 46.7%. Stanton has the second highest age-based (65+) disability with 39.1%.
When you compare these cities on the ACS dashboard, it reveals that the cities with the lowest proportion of disabled older adults are richer, whiter, better educated, with better healthcare and with more internet connectivity than the cities which have a higher proportion of disabled older adults.
The Dayle McIntosh Center is focused on disabilities for all ages, and provides an information and referral center for community resources, peer support programs, help with independent living skills, assistive technology, help navigating barriers, and senior housing resources (assistive living). When asked how people find the Dayle McIntosh Center, they said that they get a lot of referrals from 2-1-1, the California Department of Rehabilitation, and senior centers. Dayle McIntosh follows the “no wrong door” approach to referrals where it doesn’t matter how an older adult enters the system (call center, referral, senior center, etc) as they all lead to the right place to get their needs met.
Peer support groups give people an opportunity to talk and listen to people who are experiencing the same things they are going through. It reduces isolation and loneliness. Their clients are largely white and they have noticed significant barriers with older adults of Asian descent who tend to not participate in peer support groups.
They indicated that their biggest unmet needs are housing and in-home care. Caregiving is really needed but very expensive. They shared stories of people having food but they can’t cut or prepare it for cooking.

California’s Master Plan for Aging Initiatives Relating to Disabilities (Diversity, Equity & Inclusion)
Reference numbers relate to California’s Master Plan for Aging’s Five Bold Goals for 2030 to be used with their progress dashboard and budget.
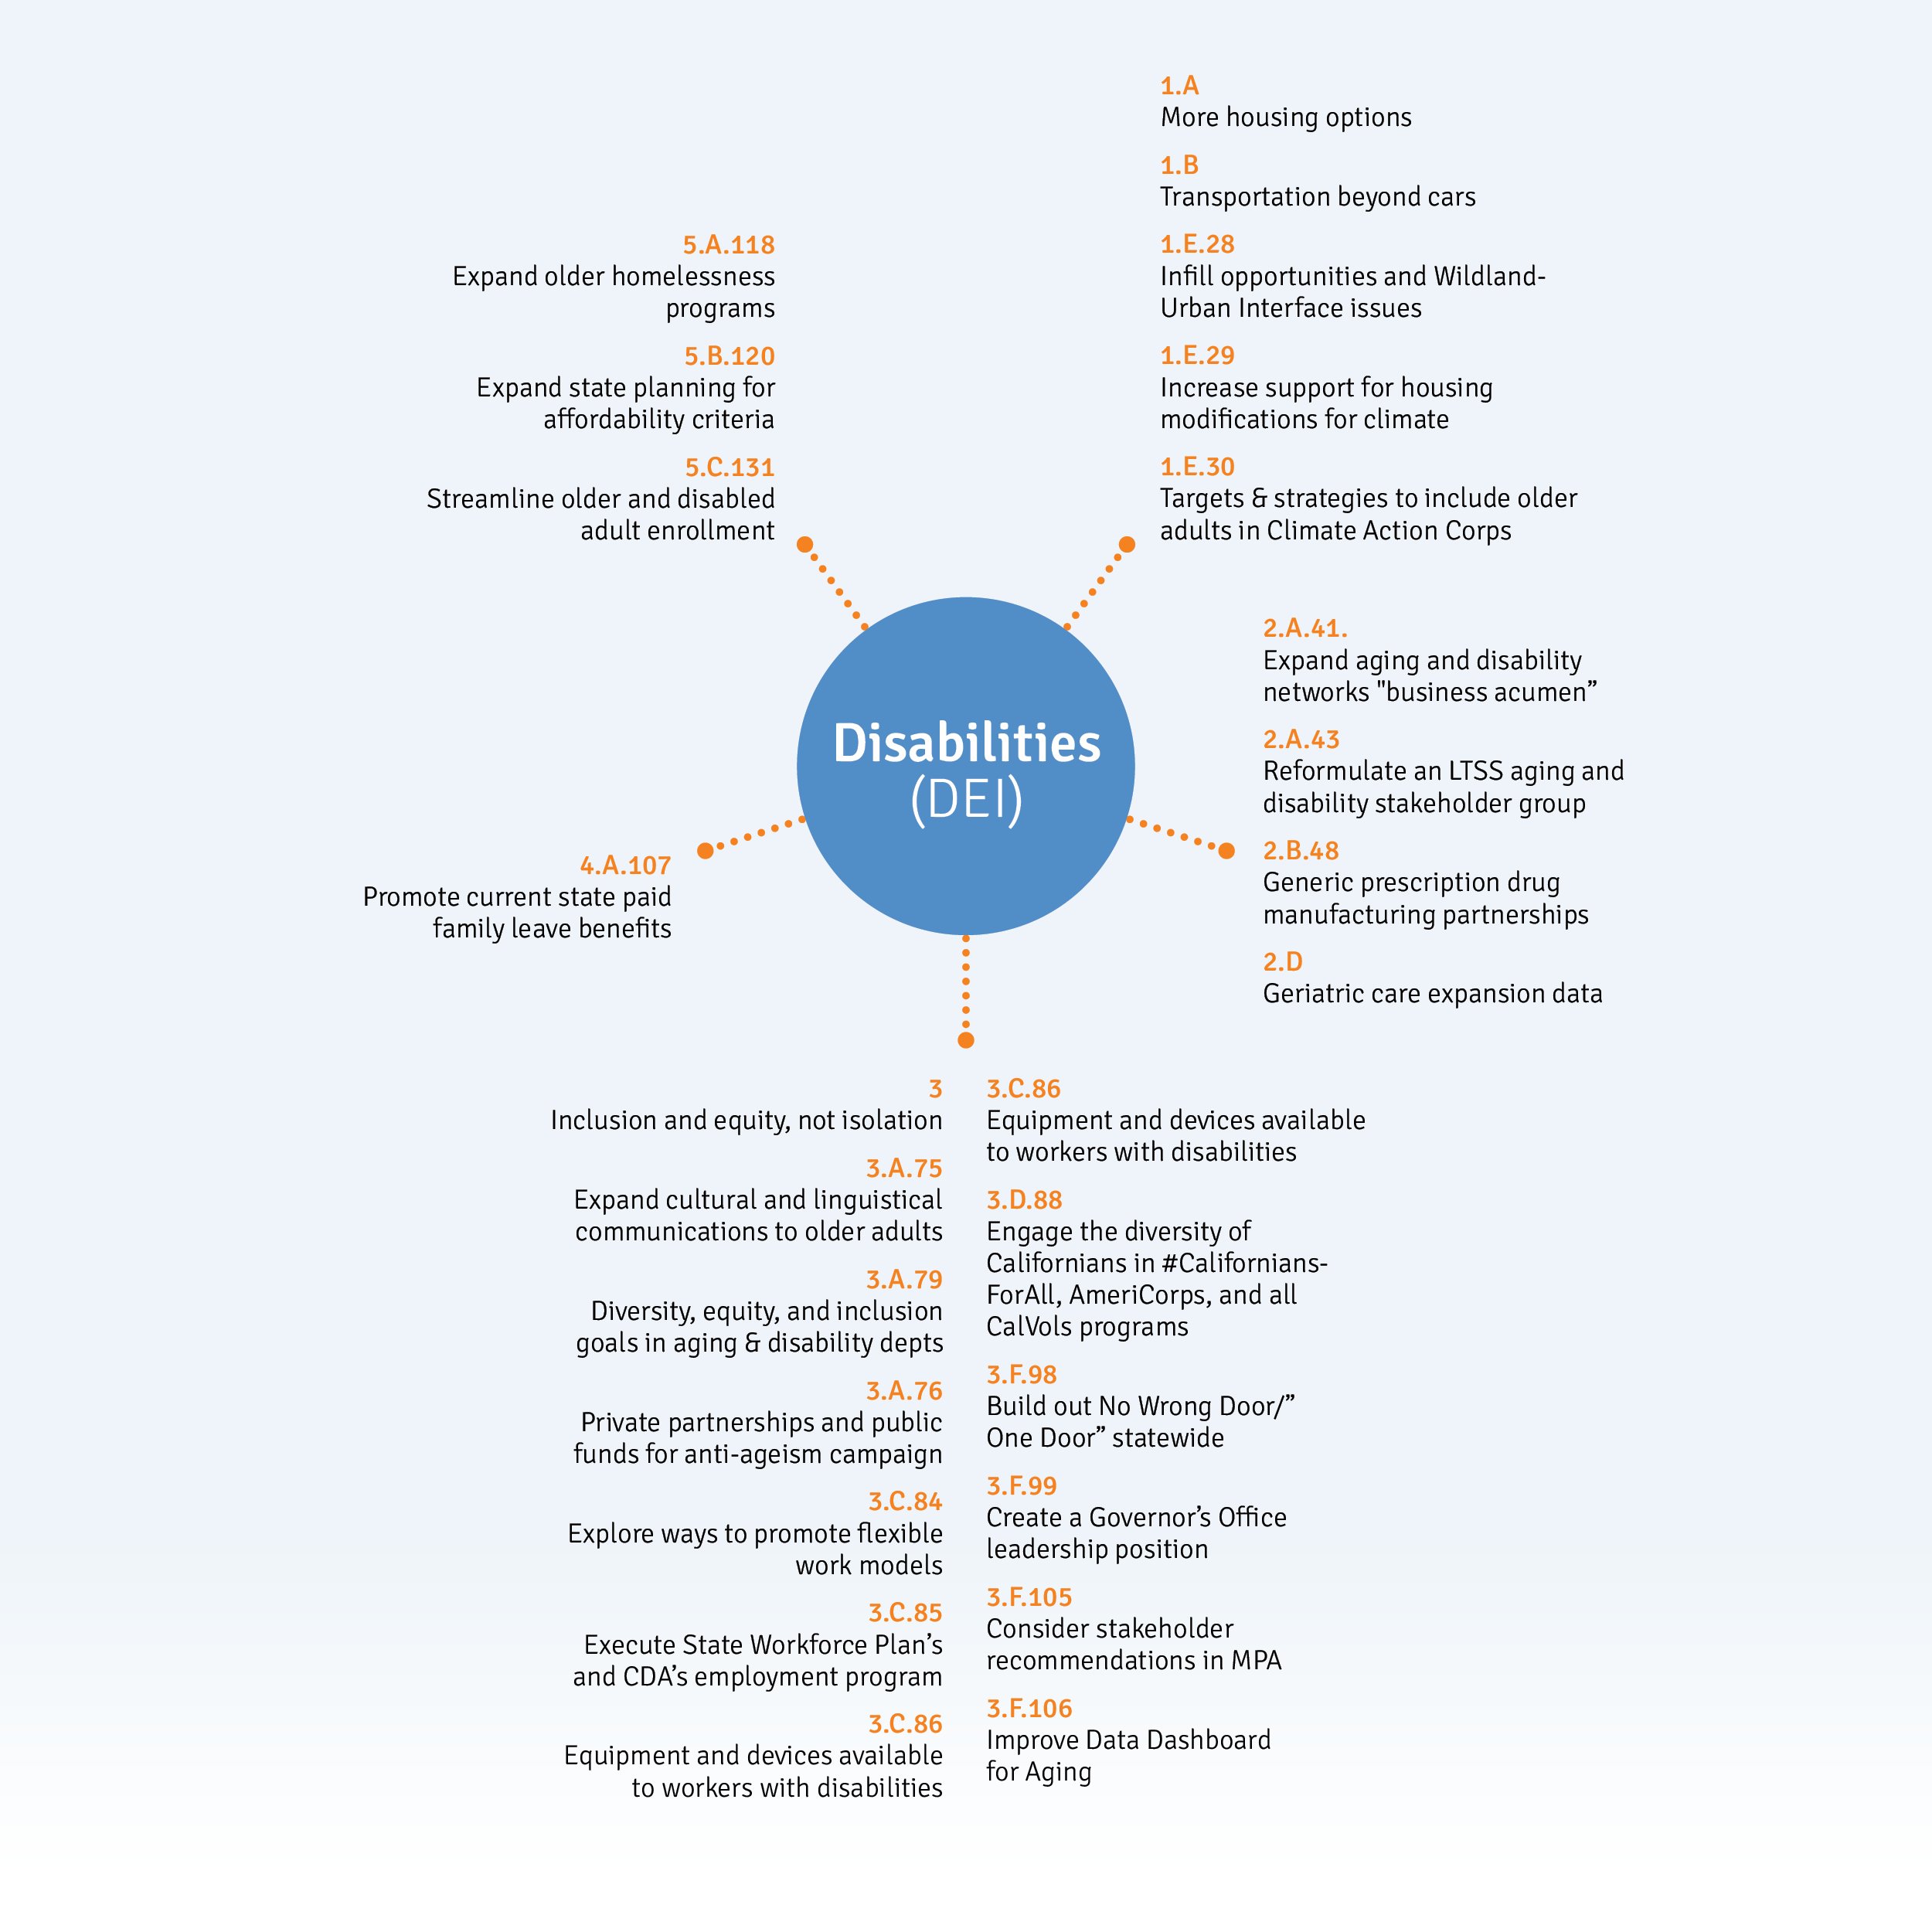
The subject of disabilities is highly represented in the California Master Plan for Aging. It does in fact note in initiative 3.F.105 that a discussion is under way to broaden the Master Plan to cover both Aging and Disability. The implication is that the two are highly interrelated with many of the same underlying issues, such as affordability, equity and inclusion, mobility and transport, and how they relate to jobs, housing and food.
Equity and inclusion is a consistent theme, and most notably the MPA seeks to lead by example and by representation, to have leadership positions and government departments reflect the issues they seek to solve. This includes flexible work conditions, job training, and assistive technologies to make it possible. The state workforce plan will map available jobs to older adults and people with disabilities, and offer training and apprenticeships. In support of this, there is a shift of mindset, given momentum by an anti-ageism and equity campaign “California for All Ages” with public-private funding.
Affordability crosses many issues, from housing to medication and food, as well as financial work and leave benefits for family members to manage their care needs. Generic drugs are singled out in initiative 2.B.48 as in need of “new generic prescription drug manufacturing partnerships” to make sure the burden of cost is lowered.
Housing crosses over with affordability not only through the supply of more “options to meet the needs of all stages of life for all people, regardless of age, race, income, ability, or household size”, but also via the issue of climate change adaptation. The safety and security of homes is threatened by extreme weather events, so disaster resilience comes in the form of “housing modifications for climate, via weatherization services”. Presumably this issue is of highest concern where new age and disability enabled housing has been built at the “wildland urban interface” and on “infill” spaces.
As for older adults in general, good public transportation and walkable communities go hand-in-hand. However, it is not only an expansion of transit stops that is needed, but also age- and disability-friendly education for the drivers.